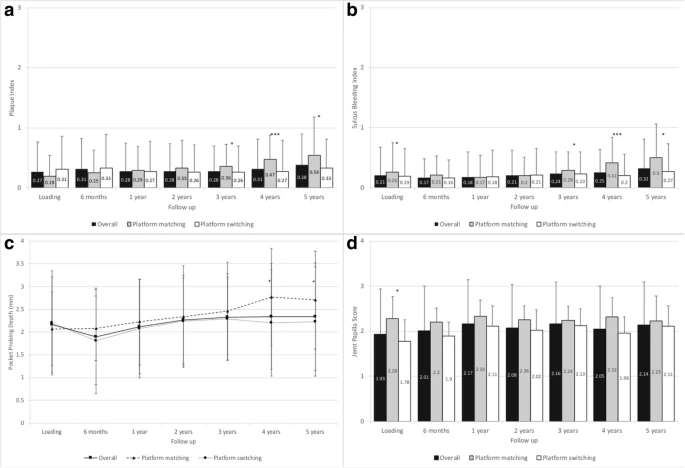
Figure 2. Clinical parameters and soft tissue parameters. a Modified plaque index. Error bars indicate standard deviation. * = p ≤ 0.05, *** = p ≤ 0.001. b Sulcus bleeding index. Error bars indicate standard deviation. * = p ≤ 0.05, *** = p ≤ 0.001. c Pocket probing depth. The asterisk represents statistically significant differences (* = p ≤ 0.05) observed between subgroups. d Jemt papilla score. The asterisk represents statistically significant differences (* = p ≤ 0.05) observed between subgroups
Figure 2. Clinical parameters and soft tissue parameters
author: Sven Marcus Beschnidt,Claudio Cacaci,Kerem Dedeoglu,Detlef Hildebrand,Helfried Hulla,Gerhard Iglhaut,Gerald Krennmair,Markus Sch | publisher: drg. Andreas Tjandra, Sp. Perio, FISID

Serial posts:
- Implant success and survival rates in daily dental practice
- Background: Implant success and survival rates (1)
- Background: Implant success and survival rates (2)
- Methods: Implant success and survival rates (1)
- Methods: Implant success and survival rates (2)
- Methods: Implant success and survival rates (3)
- Methods: Implant success and survival rates (4)
- Results: Implant success and survival rates (1)
- Results: Implant success and survival rates (2)
- Results: Implant success and survival rates (3)
- Discussion and conclusions: Implant success and survival rates (1)
- Discussion and conclusions: Implant success and survival rates (2)
- Discussion and conclusions: Implant success and survival rates (3)
- Discussion and conclusions: Implant success and survival rates (4)
- Discussion and conclusions: Implant success and survival rates (5)
- Discussion and conclusions: Implant success and survival rates (6)
- Abbreviations & References: Implant success and survival rates
- Table 1 Table of study centers
- Table 2 Patient demographics
- Table 3 Patient demographics with respect to implants
- Table 4 Life table analysis showing the cumulative success rate according to Albrektsson et al. and Buser et al.
- Figure 1. Study flow diagram
- Figure 2. Clinical parameters and soft tissue parameters
- Figure 3. Bone level changes from loading to 5-year follow up
- Figure 4. Patient satisfaction throughout the study