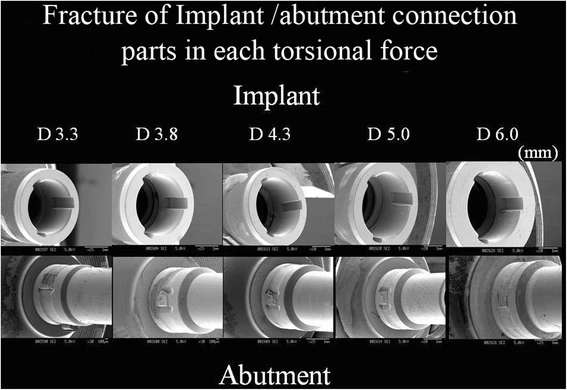
Figure 5. SEM picture of CAMLOG implant after torsion test
Figure 5. SEM picture of CAMLOG implant after torsion test
author: Fumihiko Watanabe,Kazuhiko Hiroyasu, Kazuhiko Ueda | publisher: drg. Andreas Tjandra, Sp. Perio, FISID
Figure 5. SEM picture of CAMLOG implant after torsion test

Serial posts:
- The fracture strength by a torsion test at the implant-abutment interface
- Background : The fracture strength by a torsion test at the implant-abutment interface
- Methods : The fracture strength by a torsion test at the implant-abutment interface
- Discussion : The fracture strength by a torsion test at the implant-abutment interface (1)
- Discussion : The fracture strength by a torsion test at the implant-abutment interface (2)
- Figure 1. Torsion testing device
- Figure 3. The mean value of maximum fracture torque strength
- Figure 4. The mean value of torsional yield strength
- Figure 5. SEM picture of CAMLOG implant after torsion test
- Figure 6. SEM picture of implant with external hexagonal connection