Peri-implantitis, Diagnosis, Treatment
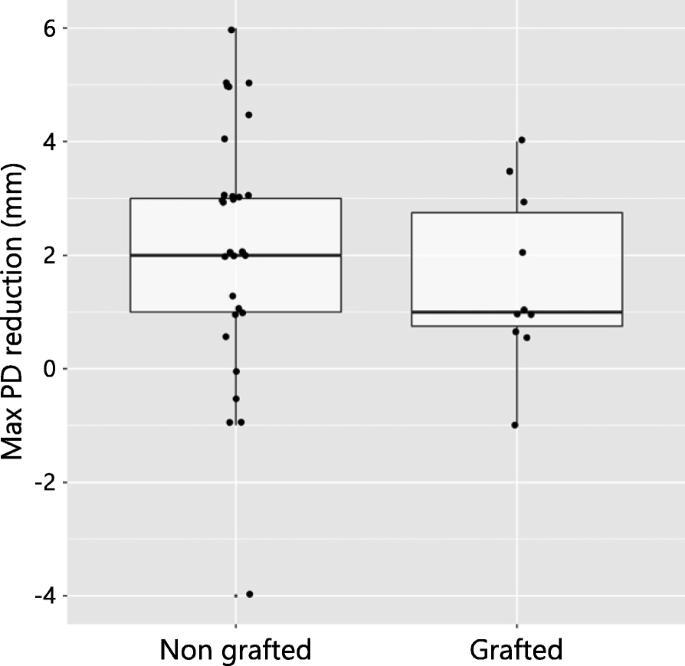
Fig. 5. Box plot illustrating maximum PD reduction between the grafted and non-grafted patient groups that did not reach a significant difference (p = 0.968) : Clinical outcomes following surgical treatment of peri-implant
author: Ausra Ramanauskaite, Kathrin Becker, Gintaras Juodzbalys, Frank Schwarz | publisher: drg. Andreas Tjandra, Sp. Perio, FISID

Fig. 5. Box plot illustrating maximum PD reduction between the grafted and non-grafted patient groups that did not reach a significant difference (p = 0.968)
Serial posts:
- Abstract : Clinical outcomes following surgical treatment of peri-implantitis at grafted and non-grafted implant sites: a retrospective analysis
- Background : Clinical outcomes following surgical treatment of peri-implantitis at grafted and non-grafted implant sites: a retrospective analysis
- Methods : Clinical outcomes following surgical treatment of peri-implantitis at grafted and non-grafted implant sites: a retrospective analysis [1]
- Methods : Clinical outcomes following surgical treatment of peri-implantitis at grafted and non-grafted implant sites: a retrospective analysis [2]
- Methods : Clinical outcomes following surgical treatment of peri-implantitis at grafted and non-grafted implant sites: a retrospective analysis [3]
- Results : Clinical outcomes following surgical treatment of peri-implantitis at grafted and non-grafted implant sites: a retrospective analysis [1]
- Results : Clinical outcomes following surgical treatment of peri-implantitis at grafted and non-grafted implant sites: a retrospective analysis [2]
- Discussion : Clinical outcomes following surgical treatment of peri-implantitis at grafted and non-grafted implant sites: a retrospective analysis [1]
- Discussion : Clinical outcomes following surgical treatment of peri-implantitis at grafted and non-grafted implant sites: a retrospective analysis [2]
- Conclusions : Clinical outcomes following surgical treatment of peri-implantitis at grafted and non-grafted implant sites: a retrospective analysis
- References : Clinical outcomes following surgical treatment of peri-implantitis at grafted and non-grafted implant sites: a retrospective analysis [1]
- References : Clinical outcomes following surgical treatment of peri-implantitis at grafted and non-grafted implant sites: a retrospective analysis [2]
- References : Clinical outcomes following surgical treatment of peri-implantitis at grafted and non-grafted implant sites: a retrospective analysis [3]
- Funding : Clinical outcomes following surgical treatment of peri-implantitis at grafted and non-grafted implant sites: a retrospective analysis
- Author information : Clinical outcomes following surgical treatment of peri-implantitis at grafted and non-grafted implant sites: a retrospective analysis
- Ethics declarations : Clinical outcomes following surgical treatment of peri-implantitis at grafted and non-grafted implant sites: a retrospective analysis
- Rights and permissions : Clinical outcomes following surgical treatment of peri-implantitis at grafted and non-grafted implant sites: a retrospective analysis
- About this article : Clinical outcomes following surgical treatment of peri-implantitis at grafted and non-grafted implant sites: a retrospective analysis
- Table 1 Implant site characteristics : Clinical outcomes following surgical treatment of peri-implantitis at grafted and non-grafted implant sites: a retrospective analysis
- Table 2 Disease resolution between the non-grafted and grafted implant sites : Clinical outcomes following surgical treatment of peri-implantitis at grafted and non-grafted implant sites: a retrospective analysis
- Table 3 Reduction of mean BOP (%) : Clinical outcomes following surgical treatment of peri-implantitis at grafted and non-grafted implant sites: a retrospective analysis
- Table 4 Reduction of maximum PD (mm) : Clinical outcomes following surgical treatment of peri-implantitis at grafted and non-grafted implant sites: a retrospective analysis
- Fig. 1. Combined surgical therapy of peri-implantitis at respective defect sites: class I: intrabony component showing either a buccal dehiscency with a semicircular component (Ib) or a buccal dehiscency with a cicumferential component (Ic). Class II: supracrestal component. The red rectangles indicate the surface areas undergoing an implantoplasty, while the green areas indicate the defect areas undergoing augmentative therapy : Clinical outcomes following surgical treatment of peri-implant
- Fig. 2. Box plot depicting no significant differences of the baseline maximum PD values between the grafted and non-grafted patient groups (p = 0.353) : Clinical outcomes following surgical treatment of peri-implant
- Fig. 3. Dumbbell—dot plots illustrating (a) disease resolution and no resolution at non-grafted and grafted sites at the patient level analysis with no significant difference between the two groups (p = 0.579). Patents with improvement, deterioration, and no improvement following the treatment based on the max PD changes are depicted; (b) disease resolution and no resolution at the implants in non-grafted and grafted sites. Significantly higher disease resolution in the grafted implant group (p = 0.048) : Clinical outcomes following surgical treatment of peri-implant
- Fig. 4. Box plot presenting mean BOP reduction between the two patient groups (grafted and non-grafted) with no significant difference (p = 0.778) : Clinical outcomes following surgical treatment of peri-implant
- Fig. 5. Box plot illustrating maximum PD reduction between the grafted and non-grafted patient groups that did not reach a significant difference (p = 0.968) : Clinical outcomes following surgical treatment of peri-implant