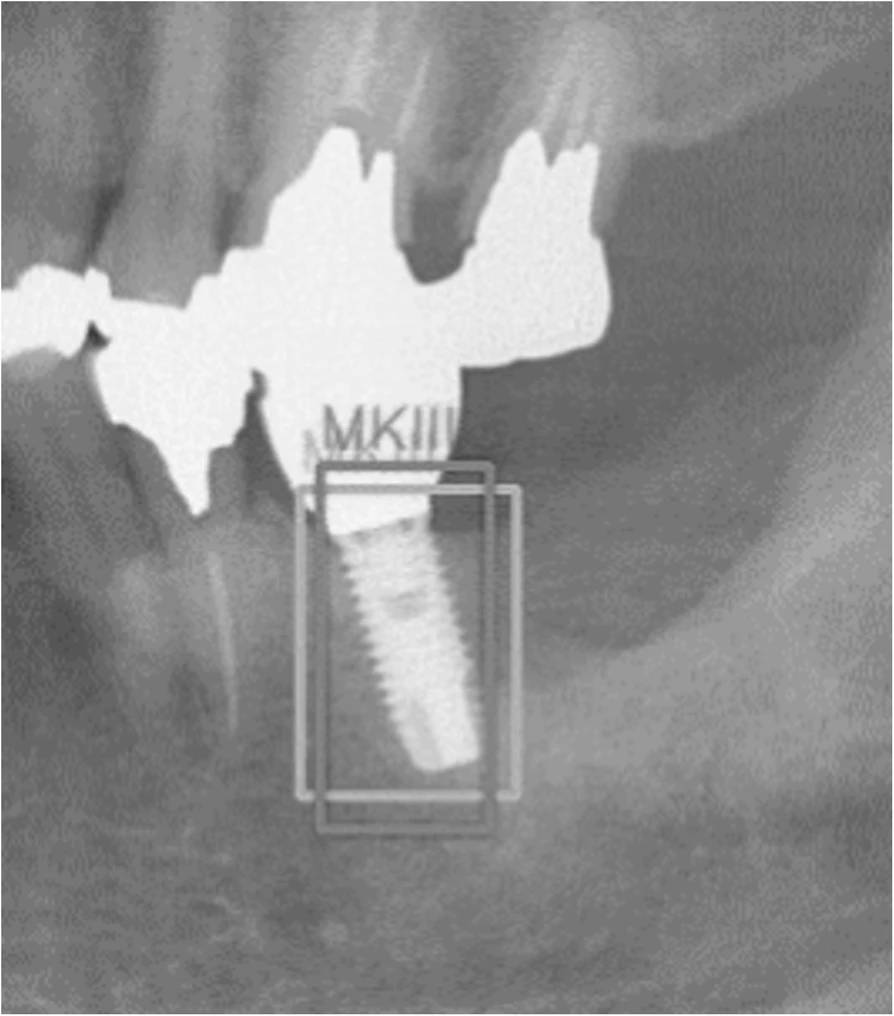
Figure 1. Sample image for calculating IoU (MK III implant). The light gray square indicates the ground-truth bounding box, and the dark gray square indicates the predicted bounding box. IoU value was calculated that the overlapped area of light gray and dark gray squares was divided by the united area of light gray and dark gray squares.
Figure 1: Sample image for calculating IoU (MK III implant)
author: Toshihito Takahashi,Kazunori Nozaki,Tomoya Gonda,Tomoaki Mameno, Masahiro Wada, Kazunori Ikebe | publisher: drg. Andreas Tjandra, Sp. Perio, FISID

Serial posts:
- Identification of dental implants using deep learning — pilot study
- Background : Identification of dental implants using deep learning
- Method : Identification of dental implants using deep learning
- Results & Discussion : Identification of dental implants using deep learning (1)
- Results & Discussion : Identification of dental implants using deep learning (2)
- Results & Discussion : Identification of dental implants using deep learning (3)
- Conclusion : Identification of dental implants using deep learning
- Figure 1: Sample image for calculating IoU (MK III implant)
- Figure 2. Total number of objects of each implant systemin all images.
- Figure 3. The total number of implant systems detected correctly (TPs)
- Figure 4. Ratio of implant systems detected correctly to all detected systems
- Figure 5. Average precision (AP) of each implant system in all images
- Figure 6. Sample images of misdetected implants