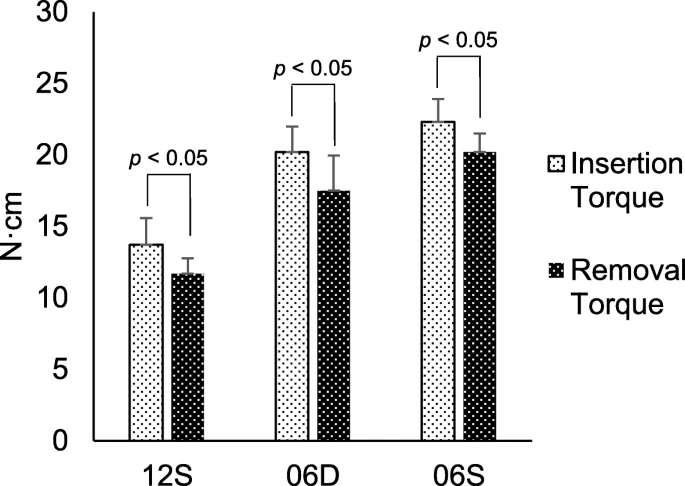
Figure 3. Comparison between IT and RT. Maximum IT value was measured when insertion was terminated. Immediately after insertion, the implant was removed, and the RT value was measured when removal commenced
Figure 3. Comparison between IT and RT
author: Yoko Yamaguchi,Makoto Shiota,Masaki Fujii,Masahiro Shimogishi, Motohiro Munakata | publisher: drg. Andreas Tjandra, Sp. Perio, FISID

Serial posts:
- Effects of implant thread design on primary stability
- Introduction : Effects of implant thread design on primary stability
- Methods : Effects of implant thread design on primary stability
- Results : Effects of implant thread design on primary stability
- Discussion : Effects of implant thread design on primary stability (1)
- Discussion : Effects of implant thread design on primary stability (2)
- Discussion : Effects of implant thread design on primary stability (3)
- Discussion : Effects of implant thread design on primary stability (4)
- Discussion : Effects of implant thread design on primary stability (5)
- References : Effects of implant thread design on primary stability
- Figure 1. Implant code 12S
- Figure 2. Insertion torque (IT), removal torque (RT), and implant stability quotient (ISQ)
- Figure 3. Comparison between IT and RT
- Figure 4. Torque kinetics. Immediately after insertion terminated, the implant was removed using the same load and rotation speed. Torque kinetics were measured during implant insertion (top) and removal (bottom)
- Figure 5. Microscopic analysis of contact interfaces
- Figure 6. Bone debris at the contact interfaces
- Table 1 Dimensions of implants
- Table 2 Insertion torque (IT), removal torque (RT), and ISQ values