Fractal analyses, Fractal dimension, Dental implants, Trabecular bone microstructure
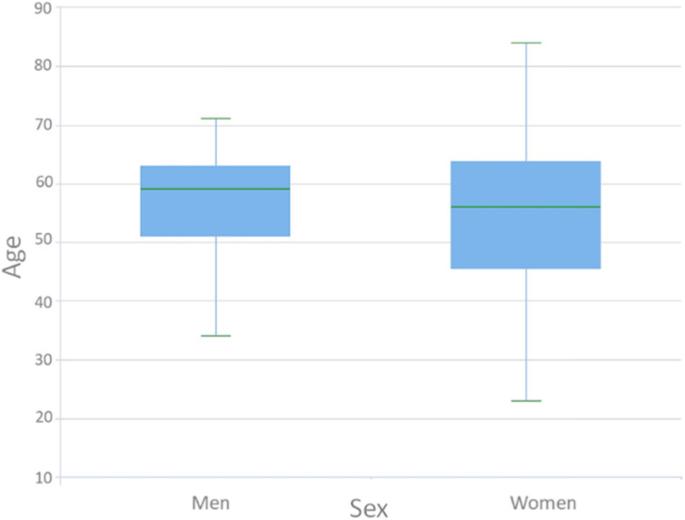
Fig. 7. The box plot shows the distribution of age between the sex groups : Evaluation of the peri-implant
author: Hatice Cansu K, Ayegl Gleryz Grbulak | publisher: drg. Andreas Tjandra, Sp. Perio, FISID

Fig. 7. The box plot shows the distribution of age between the sex groups
Serial posts:
- Abstract : Evaluation of the peri-implant bone trabecular microstructure changes in short implants with fractal analysis
- Backgrounds : Evaluation of the peri-implant bone trabecular microstructure changes in short implants with fractal analysis [1]
- Backgrounds : Evaluation of the peri-implant bone trabecular microstructure changes in short implants with fractal analysis [2]
- Materials and methods : Evaluation of the peri-implant bone trabecular microstructure changes in short implants with fractal analysis [1]
- Materials and methods : Evaluation of the peri-implant bone trabecular microstructure changes in short implants with fractal analysis [2]
- Results : Evaluation of the peri-implant bone trabecular microstructure changes in short implants with fractal analysis
- Discussion : Evaluation of the peri-implant bone trabecular microstructure changes in short implants with fractal analysis [1]
- Discussion : Evaluation of the peri-implant bone trabecular microstructure changes in short implants with fractal analysis [2]
- Conclusion : Evaluation of the peri-implant bone trabecular microstructure changes in short implants with fractal analysis
- Availability of data and materials : Evaluation of the peri-implant bone trabecular microstructure changes in short implants with fractal analysis
- Abbreviations : Evaluation of the peri-implant bone trabecular microstructure changes in short implants with fractal analysis
- References : Evaluation of the peri-implant bone trabecular microstructure changes in short implants with fractal analysis [1]
- References : Evaluation of the peri-implant bone trabecular microstructure changes in short implants with fractal analysis [2]
- References : Evaluation of the peri-implant bone trabecular microstructure changes in short implants with fractal analysis [3]
- Acknowledgements : Evaluation of the peri-implant bone trabecular microstructure changes in short implants with fractal analysis
- Funding : Evaluation of the peri-implant bone trabecular microstructure changes in short implants with fractal analysis
- Author information : Evaluation of the peri-implant bone trabecular microstructure changes in short implants with fractal analysis
- Ethics declarations : Evaluation of the peri-implant bone trabecular microstructure changes in short implants with fractal analysis
- Additional information : Evaluation of the peri-implant bone trabecular microstructure changes in short implants with fractal analysis
- Rights and permissions : Evaluation of the peri-implant bone trabecular microstructure changes in short implants with fractal analysis
- About this article : Evaluation of the peri-implant bone trabecular microstructure changes in short implants with fractal analysis
- Table 1 Distribution and description of FD1 and FD2 values, crown-implant ratios, and sex difference between the implant failure and success groups : Evaluation of the peri-implant bone trabecular microstructure changes in short implants with fractal analysis
- Table 2 Mean fractal dimension (FD) values before and after implant insertion : Evaluation of the peri-implant bone trabecular microstructure changes in short implants with fractal analysis
- Fig. 1. Fractal dimension values measured from the same area of interest on each panoramic radiograph over five different time intervals are shown in the figure. FD0, fractal dimension 0 (preoperative); FD1, fractal dimension 1 (0–1 months of follow-up); FD2, fractal dimension 2 (1–3 months of follow-up); FD3, fractal dimension 3 (6–12 months of follow-up); FD4, fractal dimension 4 (12 + months of follow-up) : Evaluation of the peri-implant
- Fig. 2. Region of interests (ROIs) were selected arbitrarily in a preoperative radiographic image and b a follow-up radiographic image : Evaluation of the peri-implant
- Fig. 3. Fractal analysis stages. a Selected region of interest (ROI). b Cropped and duplicated version of ROI. c Addition of Gaussian filter. d Subtraction. e Addition of 128 pixels. f Binarized version. g Eroded version. h Dilated version. i Inverted version j Skeletonization : Evaluation of the peri-implant
- Fig. 4. The crown-implant ratio measurement showing a the length of the crown (red line) and b the length of the implant (red line) : Evaluation of the peri-implant
- Fig. 5. Pie charts shows the distribution of the demographic datas of the patients : Evaluation of the peri-implant
- Fig. 6. Pie chart shows the distribution of loaded implants prosthetic restorations : Evaluation of the peri-implant
- Fig. 7. The box plot shows the distribution of age between the sex groups : Evaluation of the peri-implant