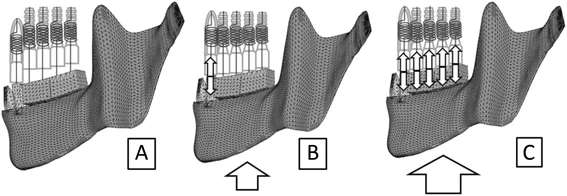
Figure 5. Schematic diagram for each phase of the load-displacement curve after occlusal adjustment of implants. a: Before loading, only anterior natural teeth were in contact with opposing teeth. Occlusal forces were not yet exerted anywhere. b: When a slight load caused the displacement of the mandible upward by the distance corresponding to the gap, i.e., the quantity of occlusal adjustment, the anterior teeth displaced into the socket and the implants were in contact with antagonists. Occlusal force was exerted only on anterior teeth. c: If the gaps were determined such that occlusal adjustment was completed, occlusal forces were distributed among natural teeth and implants under certain amounts of load
Figure 5. Schematic diagram for each phase of the load-displacement curve
author: Sho Kayumi,Yoshiyuki Takayama,Atsuro Yokoyama,Nana Ueda | publisher: drg. Andreas Tjandra, Sp. Perio, FISID

Serial posts:
- Effect of bite force in occlusal adjustment of dental implants
- Background : Effect of bite force in occlusal adjustment of dental implants
- Methods : Effect of bite force in occlusal adjustment of dental implants (1)
- Methods : Effect of bite force in occlusal adjustment of dental implants (2)
- Methods : Effect of bite force in occlusal adjustment of dental implants (3)
- Results : Effect of bite force in occlusal adjustment of dental implants (1)
- Results : Effect of bite force in occlusal adjustment of dental implants (2)
- Discussion : Effect of bite force in occlusal adjustment of dental implants (3)
- Discussion : Effect of bite force in occlusal adjustment of dental implants (3)
- Discussion : Effect of bite force in occlusal adjustment of dental implants (4)
- Table 1 Material properties
- Table 2 Size of each gap
- Figure 1. Finite element models (model-I and model-T)
- Figure 2. Boundary conditions to verify the displaceability of teeth
- Figure 3. Load-displacement curves of the springs
- Figure 4. Occlusal adjustment was simulated by altering the load-displacement curves of the springs
- Figure 5. Schematic diagram for each phase of the load-displacement curve
- Figure 6. FE model with natural dentition (model-N). Tooth root is displayed with permeability
- Figure 7. Load-displacement curve of the left canine
- Figure 8. Distribution of the occlusal forces