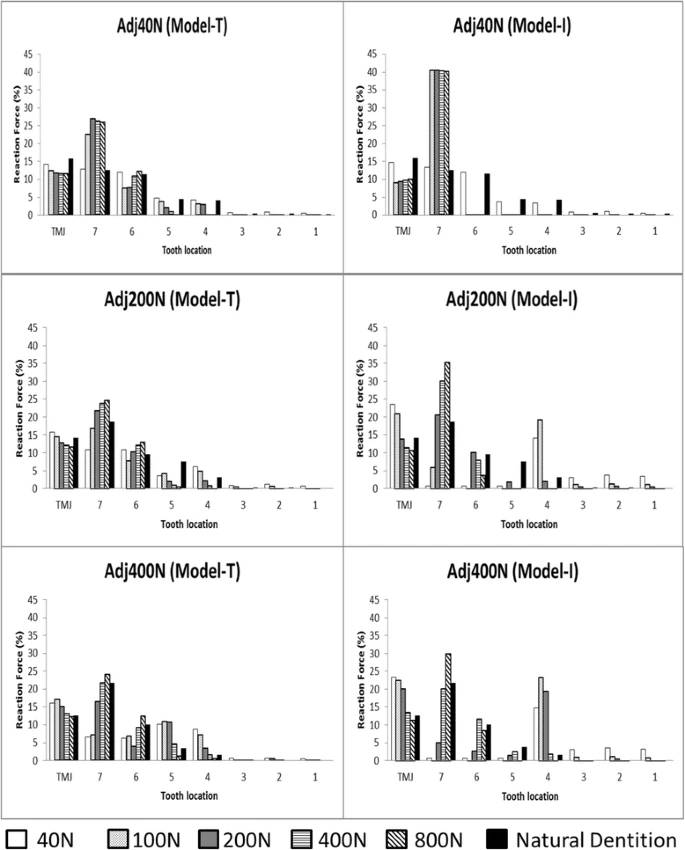
Figure 8. Distribution of the occlusal forces. Left column: model-T, right column: model-I, “Natural dentition” indicates the results in model-N under the load during occlusal adjustment
Figure 8. Distribution of the occlusal forces
author: Sho Kayumi,Yoshiyuki Takayama,Atsuro Yokoyama,Nana Ueda | publisher: drg. Andreas Tjandra, Sp. Perio, FISID

Serial posts:
- Effect of bite force in occlusal adjustment of dental implants
- Background : Effect of bite force in occlusal adjustment of dental implants
- Methods : Effect of bite force in occlusal adjustment of dental implants (1)
- Methods : Effect of bite force in occlusal adjustment of dental implants (2)
- Methods : Effect of bite force in occlusal adjustment of dental implants (3)
- Results : Effect of bite force in occlusal adjustment of dental implants (1)
- Results : Effect of bite force in occlusal adjustment of dental implants (2)
- Discussion : Effect of bite force in occlusal adjustment of dental implants (3)
- Discussion : Effect of bite force in occlusal adjustment of dental implants (3)
- Discussion : Effect of bite force in occlusal adjustment of dental implants (4)
- Table 1 Material properties
- Table 2 Size of each gap
- Figure 1. Finite element models (model-I and model-T)
- Figure 2. Boundary conditions to verify the displaceability of teeth
- Figure 3. Load-displacement curves of the springs
- Figure 4. Occlusal adjustment was simulated by altering the load-displacement curves of the springs
- Figure 5. Schematic diagram for each phase of the load-displacement curve
- Figure 6. FE model with natural dentition (model-N). Tooth root is displayed with permeability
- Figure 7. Load-displacement curve of the left canine
- Figure 8. Distribution of the occlusal forces