Clinical study, Alveolar ridge augmentation, Tooth transplantation
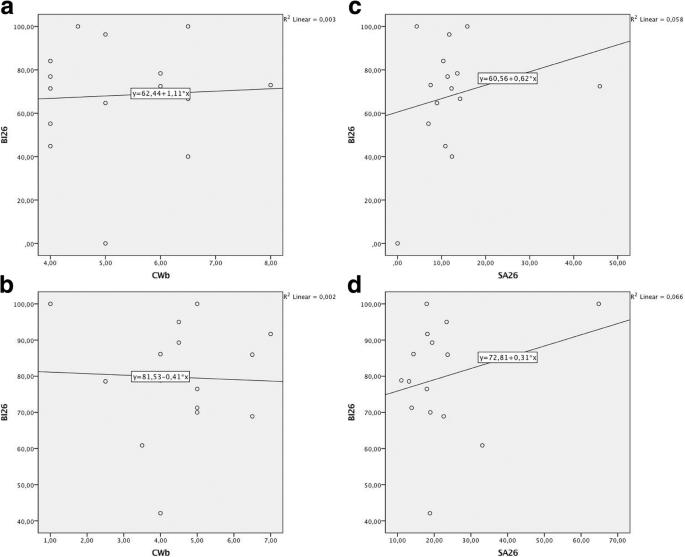
Fig. 4. Linear regression plots to depict the relationship between BI26 and CWb/SA26 values. a CWb (TR group). b CWb (AB group). c SA26 (TR group). d SA26 (AB group) : Radiographic outcomes following lateral alveolar r
author: Puria Parvini, Robert Sader, Didem Sahin, Jrgen Becker, Frank Schwarz | publisher: drg. Andreas Tjandra, Sp. Perio, FISID

Fig. 4. Linear regression plots to depict the relationship between BI26 and CWb/SA26 values. a CWb (TR group). b CWb (AB group). c SA26 (TR group). d SA26 (AB group)
Serial posts:
- Abstract : Radiographic outcomes following lateral alveolar ridge augmentation using autogenous tooth roots
- Background : Radiographic outcomes following lateral alveolar ridge augmentation using autogenous tooth roots
- Methods : Radiographic outcomes following lateral alveolar ridge augmentation using autogenous tooth roots [1]
- Methods : Radiographic outcomes following lateral alveolar ridge augmentation using autogenous tooth roots [2]
- Methods : Radiographic outcomes following lateral alveolar ridge augmentation using autogenous tooth roots [3]
- Results : Radiographic outcomes following lateral alveolar ridge augmentation using autogenous tooth roots
- Discussion : Radiographic outcomes following lateral alveolar ridge augmentation using autogenous tooth roots [1]
- Discussion : Radiographic outcomes following lateral alveolar ridge augmentation using autogenous tooth roots [2]
- Conclusions : Radiographic outcomes following lateral alveolar ridge augmentation using autogenous tooth roots
- References : Radiographic outcomes following lateral alveolar ridge augmentation using autogenous tooth roots
- Author information : Radiographic outcomes following lateral alveolar ridge augmentation using autogenous tooth roots
- Ethics declarations : Radiographic outcomes following lateral alveolar ridge augmentation using autogenous tooth roots
- Rights and permissions : Radiographic outcomes following lateral alveolar ridge augmentation using autogenous tooth roots
- About this article : Radiographic outcomes following lateral alveolar ridge augmentation using autogenous tooth roots
- Table 1 Study design and follow up visits : Radiographic outcomes following lateral alveolar ridge augmentation using autogenous tooth roots
- Table 2 Secondary performance endpoints (in mm) : Radiographic outcomes following lateral alveolar ridge augmentation using autogenous tooth roots
- Fig. 1. Lateral ridge augmentation—a surgical procedure in the AB and TR groups
- Fig. 2. Radiographic assessments. Images of the coronal planes representing the most central aspect of the respective defect sites were analyzed for the basal graft integration (i.e., contact between the graft and the host bone in %) (BI26) and the cross-sectional grafted area (mm2) (SA26) : Radiographic outcomes following lateral alveolar r
- Fig. 3. Representative CBCT outcomes at 26 weeks. a, b TR graft. c, d AB graft : Radiographic outcomes following lateral alveolar r
- Fig. 4. Linear regression plots to depict the relationship between BI26 and CWb/SA26 values. a CWb (TR group). b CWb (AB group). c SA26 (TR group). d SA26 (AB group) : Radiographic outcomes following lateral alveolar r