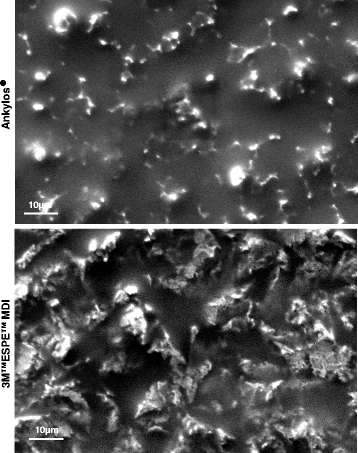
Figure 2. Implant surface characterization under SEM. Increased surface roughness in the 3M™ESPE™ MDI dental implants when compared to Ankylos® implants
Figure 2. Implant surface characterization under SEM
author: Jagjit Singh Dhaliwal,Juliana Marulanda,Jingjing Li,Sharifa Alebrahim,Jocelyne Sheila Feine, Monzur Murshed | publisher: drg. Andreas Tjandra, Sp. Perio, FISID

Serial posts:
- In vitro comparison of two titanium dental implant surface treatments
- Background : Comparison of two titanium dental implant surface treatments
- Methods : Comparison of two titanium dental implant surface treatments (1)
- Results : Comparison of two titanium dental implant surface treatments
- Methods : Comparison of two titanium dental implant surface treatments (2)
- Methods : Comparison of two titanium dental implant surface treatments (3)
- Discussion : Comparison of two titanium dental implant surface treatments (1)
- Discussion : Comparison of two titanium dental implant surface treatments (2)
- Discussion : Comparison of two titanium dental implant surface treatments (3)
- Figure 1. Preparation of specimens
- Figure 2. Implant surface characterization under SEM
- Figure 3. Increased proliferation of C2C12 cells grown
- Figure 4. a C2C12 cells (control) and pBMP-2-transfected C2C12 cells
- Figure 5. Florescence microscopy