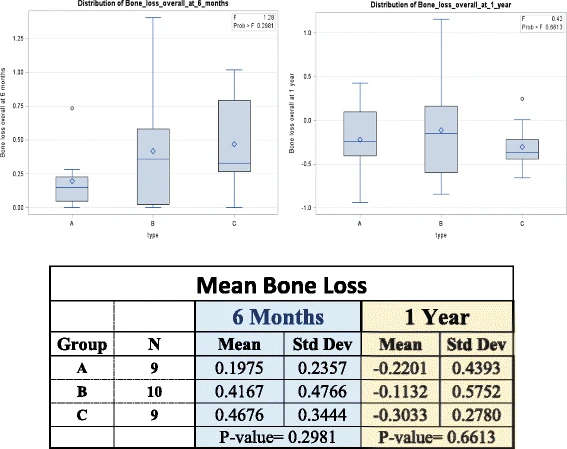
Figure 3. Mean bone loss at 6 months and 1 year. Mean bone loss distribution charts at 6 months and 1 year present no statistically significant difference. p value at 6 months was 0.2981 and at 1 year 0.6613
Figure 3. Mean bone loss at 6 months and 1 year
author: David E Simmons,Pooja Maney,Austin G Teitelbaum,Susan Billiot,Lomesh J Popat,A Archontia Palaiologou | publisher: drg. Andreas Tjandra, Sp. Perio, FISID
Figure 3. Mean bone loss at 6 months and 1 year. Mean bone loss distribution charts at 6 months and 1 year present no statistically significant difference. p value at 6 months was 0.2981 and at 1 year 0.6613

Serial posts:
- Comparative evaluation of the stability of two different dental implant designs and surgical protocols—a pilot study
- Background : Comparative evaluation of the stability of two different dental implant designs and surgical protocols—a pilot study (1)
- Background : Comparative evaluation of the stability of two different dental implant designs and surgical protocols—a pilot study (2)
- Methods : Comparative evaluation of the stability of two different dental implant designs and surgical protocols—a pilot study
- Results : Comparative evaluation of the stability of two different dental implant designs and surgical protocols—a pilot study
- Discussion : Comparative evaluation of the stability of two different dental implant designs and surgical protocols—a pilot study
- Figure 1. Implant design
- Table 1 Patient selection criteria
- Figure 2. ISQ values at placement, 6 weeks, 6 months, and 1 year
- Figure 3. Mean bone loss at 6 months and 1 year
- Table 2 Outcome success criteria