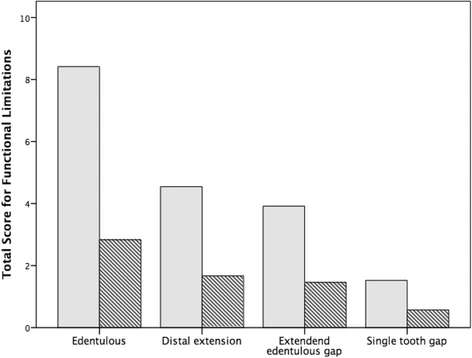
Figure 4. Total score for functional limitations before (gray) and after (hatched) sinus augmentation according to indications
Figure 4. Total score for functional limitations before (gray) and after (hatched) sinus augmentation according to indications
author: E Schiegnitz,P W Kmmerer,K Sagheb,A J Wendt,A Pabst,B Al-Nawas,M O Klein | publisher: drg. Andreas Tjandra, Sp. Perio, FISID

Serial posts:
- Impact of maxillary sinus augmentation on oral health-related quality of life
- Background : Impact of maxillary sinus augmentation on oral health-related quality of life
- Methods : Impact of maxillary sinus augmentation on oral health-related quality of life
- Results : Impact of maxillary sinus augmentation (1)
- Results : Impact of maxillary sinus augmentation (2)
- Discussion : Impact of maxillary sinus augmentation (1)
- Discussion : Impact of maxillary sinus augmentation (2)
- Discussion : Impact of maxillary sinus augmentation (3)
- References : Impact of maxillary sinus augmentation
- Figure 1. Flow chart of patients included in the study
- Figure 2. Cumulative survival rate
- Figure 3. Total score for complaints
- Figure 4. Total score for functional limitations before (gray) and after (hatched) sinus augmentation according to indications
- Figure 5. Total score for physical and psychological disabilities
- Table 1 Mean value and standard deviation
- Table 2 Mean value and standard deviation
- Table 3 Mean value and standard deviation for the subcategory complaints due to the surgical procedure