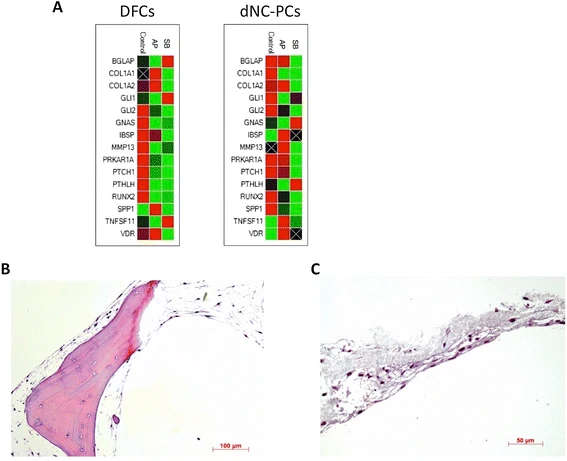
Figure 5. Evaluation of osteogenic differentiation.
Figure 5. Evaluation of osteogenic differentiation
author: Martin Gosau,Sandra Viale-Bouroncle,Hannah Eickhoff,Esthera Prateeptongkum,Anja Reck,W Gtz,Christoph Klingelhffer,Steffen Mller, | publisher: drg. Andreas Tjandra, Sp. Perio, FISID
Figure 5. Evaluation of osteogenic differentiation. (A) Clustergram of PCR-array results; (B-C) histology of differentiated dental cells on AP (B) and SB (C). Representative results are shown for dNC-PCs.

Serial posts:
- Evaluation of implant-materials as cell carriers for dental stem cells under in vitro conditions
- Background : Evaluation of implant-materials as cell carriers for dental stem cells
- Methods : Evaluation of implant-materials as cell carriers for dental stem cells (1)
- Methods : Evaluation of implant-materials as cell carriers for dental stem cells (2)
- Methods : Evaluation of implant-materials as cell carriers for dental stem cells (3)
- Methods : Evaluation of implant-materials as cell carriers for dental stem cells (4)
- Results : Evaluation of implant-materials as cell carriers for dental stem cells
- Discussion : Evaluation of implant-materials as cell carriers for dental stem cells (1)
- Discussion : Evaluation of implant-materials as cell carriers for dental stem cells (2)
- Figure 1. Cell attachment on tested materials.
- Figure 2. Cell proliferation of dNC-PCs and DFCs on tested materials
- Figure 3. Evaluation of programmed cell death (apoptosis) in dental stem cells
- Figure 4. Osteogenic differentiation of dental stem cells
- Figure 5. Evaluation of osteogenic differentiation
- Figure 6. Cultivation and osteogenic differentiation of DFCs on PA