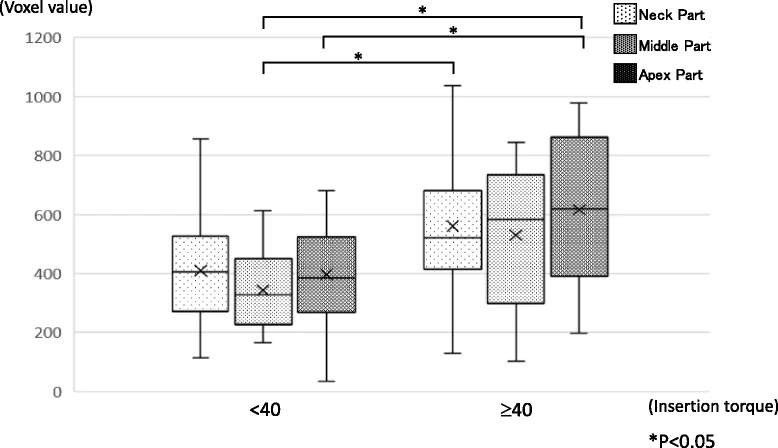
Figure 9. The comparison of two groups at average voxel values for each part. The comparison of voxel values by insertion torque. All specimens were classified into two groups by insertion torque < 40 and ≥ 40. The < 40 group represents a combination of the low and medium IT groups
Figure 9. The comparison of two groups at average voxel values for each part
author: Shinya Homma,Yasushi Makabe,Takuya Sakai,Kenzou Morinaga,Satoru Yokoue,Hirofumi Kido, Yasutomo Yajima | publisher: drg. Andreas Tjandra, Sp. Perio, FISID
Figure 9. The comparison of two groups at average voxel values for each part. The comparison of voxel values by insertion torque. All specimens were classified into two groups by insertion torque < 40 and ≥ 40. The < 40 group represents a combination of the low and medium IT groups

Serial posts:
- Prospective multicenter non-randomized controlled study on intraosseous stability and healing period for dental implants in the posterior region
- Background : Prospective multicenter non-randomized controlled study on intraosseous stability and healing period for dental implants
- Methods : Prospective multicenter non-randomized controlled study on intraosseous stability and healing period for dental implants (1)
- Results : intraosseous stability and healing period for dental implants (1)
- Methods : Prospective multicenter non-randomized controlled study on intraosseous stability and healing period for dental implants (2)
- Results : intraosseous stability and healing period for dental implants (2)
- Discussion : intraosseous stability and healing period for dental implants (1)
- Discussion : intraosseous stability and healing period for dental implants (2)
- Discussion : intraosseous stability and healing period for dental implants (3)
- Discussion : intraosseous stability and healing period for dental implants (4)
- Discussion : intraosseous stability and healing period for dental implants (5)
- Discussion : intraosseous stability and healing period for dental implants (6)
- Figure 1. Genesio® Plus implant with Aanchor surface
- Figure 2. The measurement of the voxel values
- Figure 3. The evaluation of the average ISQ. Time-lapse migration of average ISQ. Average ISQ of all specimens increased in a time-dependent manner (results indicated by a line). A significant difference was observed by 6 weeks after surgery
- Figure 4. The classification of the insertion torque. All specimens classified into three groups according to insertion torque. Criteria for the classification are shown in the figure and in the “Methods” section
- Figure 5. The comparison of ISQ values by the insertion torque
- Figure 6. The relationship between ISQ and insertion torque
- Figure 7. The average voxel value between the maxilla and mandible
- Figure 8. The relationship between average voxel value and insertion torque
- Figure 9. The comparison of two groups at average voxel values for each part
- Table 1 Treatment area and size of implant body
- Table 2 Result of IT and ISQ