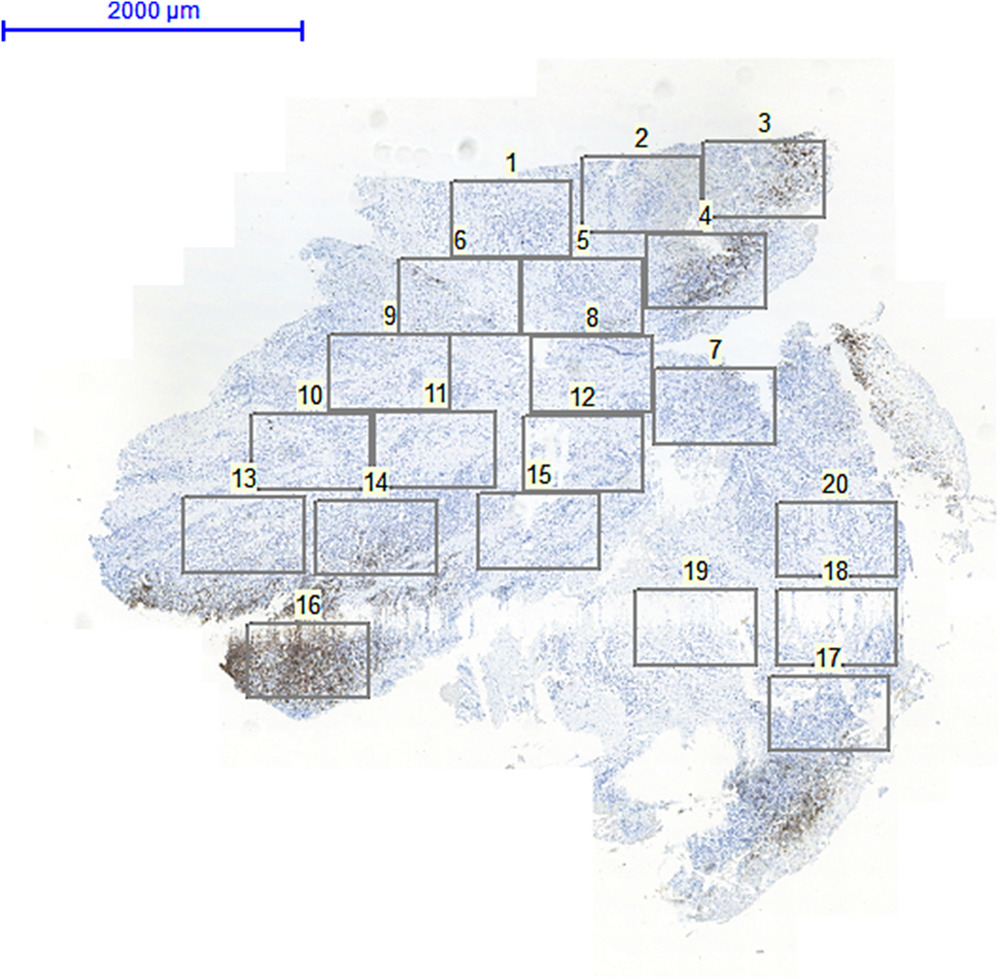
Figure 1. Histomorphometric analysis was performed in 20 randomly selected ROIs (Region of Interests).
Figure 1. Histomorphometric analysis performed in selected ROIs
author: Tobias Fretwurst,Janina Mller,Lena Larsson,Peter Bronsert,Derek Hazard,Rogerio M Castilho,Ralf Kohal,Katja Nelson,Gerhard Iglhau | publisher: drg. Andreas Tjandra, Sp. Perio, FISID
Figure 1. Histomorphometric analysis was performed in 20 randomly selected ROIs (Region of Interests).

Serial posts:
- Immunohistological composition of peri‐implantitis affected tissue around ceramic implants—A pilot study
- Introduction : Immunohistological composition of peri‐implantitis affected tissue
- Materials & methods : Immunohistological composition of peri‐implantitis affected tissue (1)
- Materials & methods : Immunohistological composition of peri‐implantitis affected tissue (2)
- Results : Immunohistological composition of peri‐implantitis affected tissue
- Discussion : Immunohistological composition of peri‐implantitis affected tissue (1)
- Discussion : Immunohistological composition of peri‐implantitis affected tissue (2)
- Discussion : Immunohistological composition of peri‐implantitis affected tissue (3)
- Figure 1. Histomorphometric analysis performed in selected ROIs
- Figure 2. Biopsies retrieved from peri‐implantitis tissue
- Figure 3. Biopsies derived from tissue around ceramic and titanium implants
- Figure 4. Stacked plot demonstrated a patient‐specific immune response
- TABLE 1. t p50, SD, minimum (min) and maximum (max) cell count for each antibody used