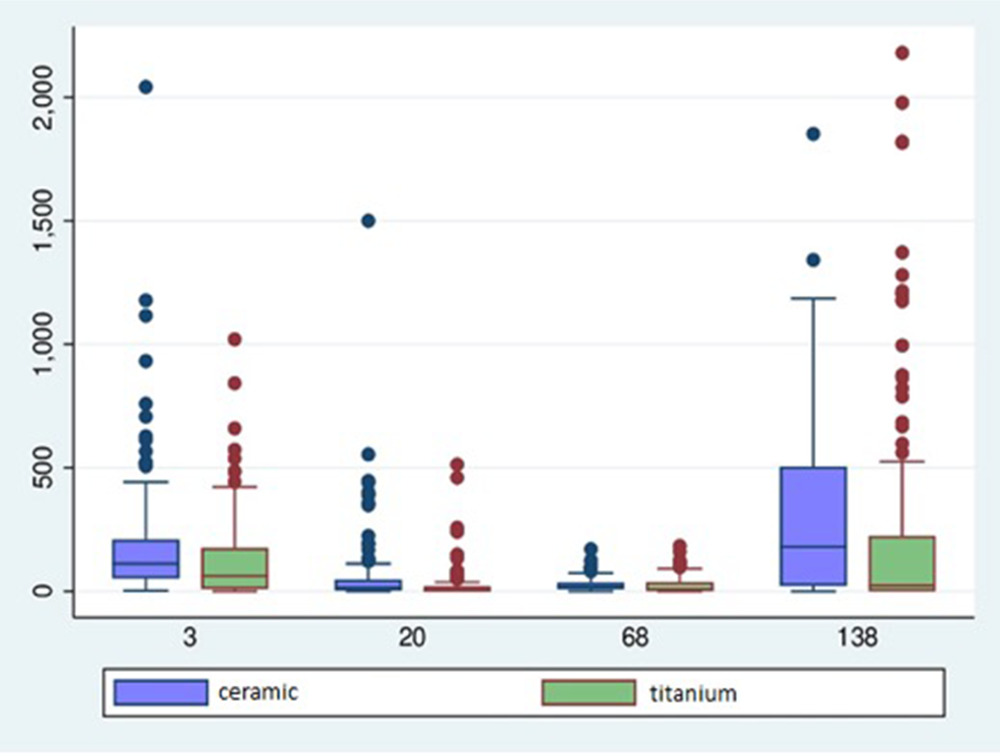
Figure 3. Biopsies derived from tissue around ceramic and titanium implants demonstrated the same numerical distribution of cell population (CD3, CD20, CD68, CD138). Cell count of each antibody in peri‐implantitis around ceramic (blue) and titanium (green) implants
Figure 3. Biopsies derived from tissue around ceramic and titanium implants
author: Tobias Fretwurst,Janina Mller,Lena Larsson,Peter Bronsert,Derek Hazard,Rogerio M Castilho,Ralf Kohal,Katja Nelson,Gerhard Iglhau | publisher: drg. Andreas Tjandra, Sp. Perio, FISID

Serial posts:
- Immunohistological composition of peri‐implantitis affected tissue around ceramic implants—A pilot study
- Introduction : Immunohistological composition of peri‐implantitis affected tissue
- Materials & methods : Immunohistological composition of peri‐implantitis affected tissue (1)
- Materials & methods : Immunohistological composition of peri‐implantitis affected tissue (2)
- Results : Immunohistological composition of peri‐implantitis affected tissue
- Discussion : Immunohistological composition of peri‐implantitis affected tissue (1)
- Discussion : Immunohistological composition of peri‐implantitis affected tissue (2)
- Discussion : Immunohistological composition of peri‐implantitis affected tissue (3)
- Figure 1. Histomorphometric analysis performed in selected ROIs
- Figure 2. Biopsies retrieved from peri‐implantitis tissue
- Figure 3. Biopsies derived from tissue around ceramic and titanium implants
- Figure 4. Stacked plot demonstrated a patient‐specific immune response
- TABLE 1. t p50, SD, minimum (min) and maximum (max) cell count for each antibody used