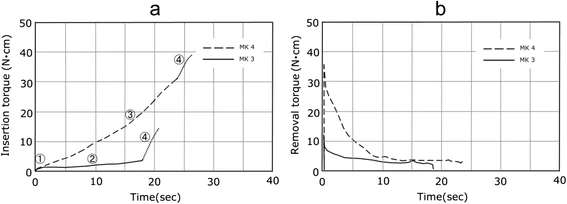
Figure 5. Torque-time curves of the MK3 and MK4. a Insertion torque. b Removal torque
Figure 5. Torque-time curves of the MK3 and MK4
author: Yoko Yamaguchi,Makoto Shiota,Motohiro Munakata,Shohei Kasugai, Masahiko Ozeki | publisher: drg. Andreas Tjandra, Sp. Perio, FISID

Serial posts:
- Effect of implant design on primary stability using torque-time curves in artificial bone
- Background : Effect of implant design on primary stability
- Methods : Effect of implant design on primary stability
- Results : Effect of implant design on primary (1)
- Results : Effect of implant design on primary (2)
- Discussion : Effect of implant design on primary (1)
- Discussion : Effect of implant design on primary (2)
- Discussion : Effect of implant design on primary (3)
- Discussion : Effect of implant design on primary (4)
- Reference : Effect of implant design on primary (4)
- Table 1 The type of the implant used for experiment
- Table 2 Insertion torque value and removal torque value
- Table 3 Torque rise rate of the each area (N · cm/s)
- Figure 1. Compressed longitudinally to one third for characteristics of implant design
- Figure 2. Torque-time curves of the ST. a Insertion torque. b Removal torque
- Figure 3. Torque-time curves of the BL. a Insertion torque. b Removal torque
- Figure 4. Torque-time curves of the TE. a Insertion torque. b Removal torque
- Figure 5. Torque-time curves of the MK3 and MK4