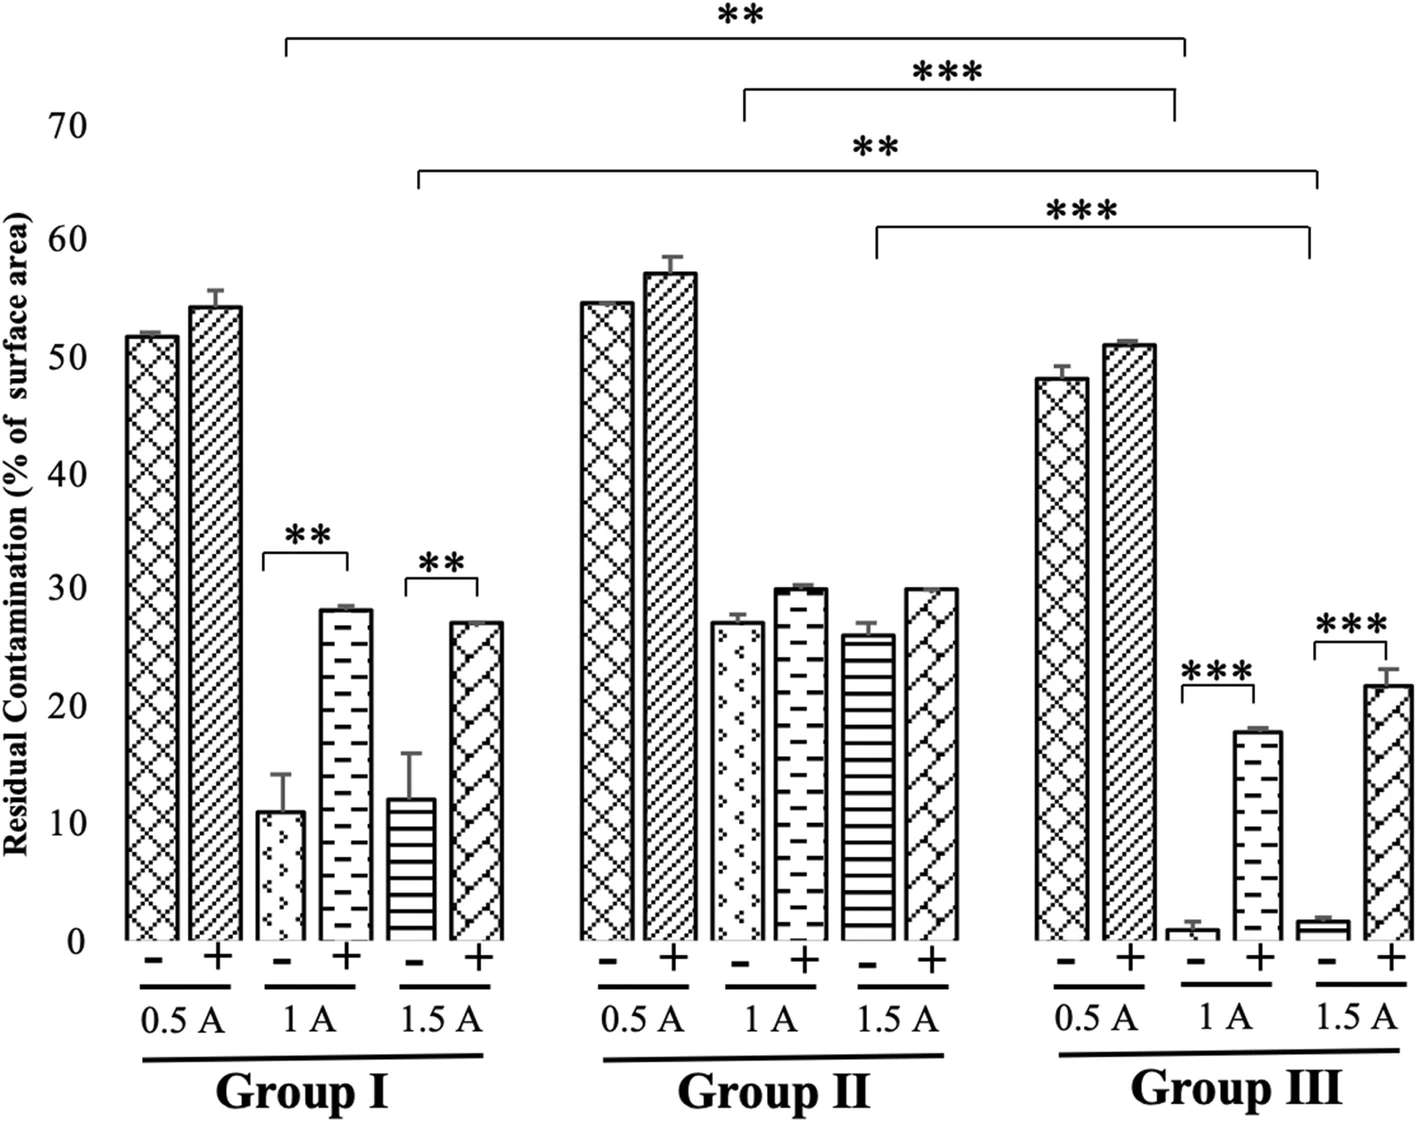
Figure 1. The amount of residual contamination after electrochemical treatments under different charges and currents at constant 10 V. Mean ± SD (n = 5). *P < 0.05, **P < 0.01, ***P < 0.005
Figure 1. The amount of residual contamination
author: Thiha Tin Kyaw,Takao Hanawa, Shohei Kasugai | publisher: drg. Andreas Tjandra, Sp. Perio, FISID
Figure 1. The amount of residual contamination after electrochemical treatments under different charges and currents at constant 10 V. Mean ± SD (n = 5). *P < 0.05, **P < 0.01, ***P < 0.005

Serial posts:
- Investigation of different electrochemical cleaning methods on contaminated healing abutments in vitro: an approach for metal surface decontamination
- Background : cleaning methods on contaminated healing abutments
- Materials and methods : cleaning methods on contaminated healing abutments
- Results : cleaning methods on contaminated healing abutments (1)
- Results : cleaning methods on contaminated healing abutments (2)
- Discussion : cleaning methods on contaminated healing abutments (1)
- CLONE-Discussion : cleaning methods on contaminated healing abutments (2)
- Discussion : cleaning methods on contaminated healing abutments (2)
- Discussion : cleaning methods on contaminated healing abutments (3)
- Discussion : cleaning methods on contaminated healing abutments (4)
- Discussion : cleaning methods on contaminated healing abutments (5)
- Table 1 pH after electrolysis.
- Table 2 Qualitative analysis of surfaces after electrolysis
- Table 3 Composition (%wt) of the surface of the healing abutment
- Figure 1. The amount of residual contamination
- Figure 2. Microscopical images of the healing abutments
- Figure 3. Representative SEM images of healing abutments