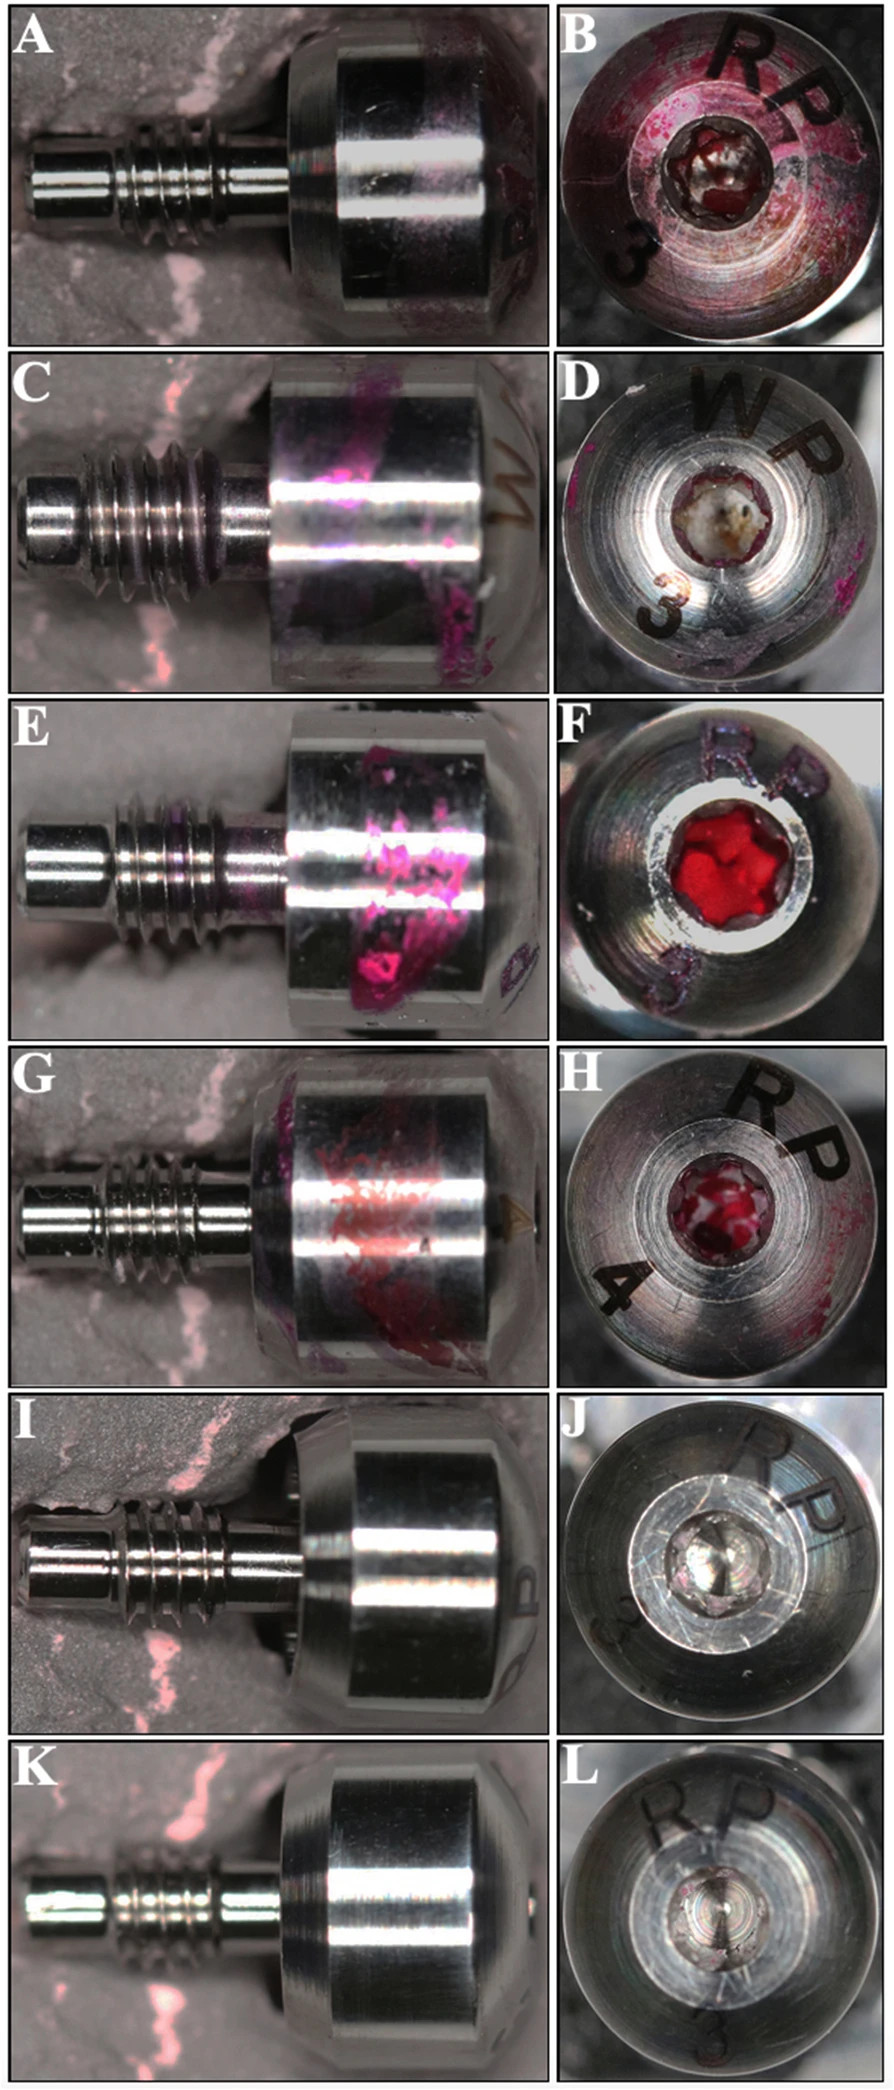
Figure 2. Microscopical images of the healing abutments after the electrochemical treatments under different currents at constant 10 V with different electrodes. The healing abutments were stained with phloxine B after electrolysis. Images from side (a, c, e, g, i, k) and from top (b, d, f, h, j, l). a, b 1 A group I. c, d 1.5 A group I. e, f 1 A group II. g, h 1.5 A group II. i, j 1 A group III. k, l 1.5 A group III
Figure 2. Microscopical images of the healing abutments
author: Thiha Tin Kyaw,Takao Hanawa, Shohei Kasugai | publisher: drg. Andreas Tjandra, Sp. Perio, FISID
Figure 2. Microscopical images of the healing abutments after the electrochemical treatments under different currents at constant 10 V with different electrodes. The healing abutments were stained with phloxine B after electrolysis. Images from side (a, c, e, g, i, k) and from top (b, d, f, h, j, l). a, b 1 A group I. c, d 1.5 A group I. e, f 1 A group II. g, h 1.5 A group II. i, j 1 A group III. k, l 1.5 A group III

Serial posts:
- Investigation of different electrochemical cleaning methods on contaminated healing abutments in vitro: an approach for metal surface decontamination
- Background : cleaning methods on contaminated healing abutments
- Materials and methods : cleaning methods on contaminated healing abutments
- Results : cleaning methods on contaminated healing abutments (1)
- Results : cleaning methods on contaminated healing abutments (2)
- Discussion : cleaning methods on contaminated healing abutments (1)
- CLONE-Discussion : cleaning methods on contaminated healing abutments (2)
- Discussion : cleaning methods on contaminated healing abutments (2)
- Discussion : cleaning methods on contaminated healing abutments (3)
- Discussion : cleaning methods on contaminated healing abutments (4)
- Discussion : cleaning methods on contaminated healing abutments (5)
- Table 1 pH after electrolysis.
- Table 2 Qualitative analysis of surfaces after electrolysis
- Table 3 Composition (%wt) of the surface of the healing abutment
- Figure 1. The amount of residual contamination
- Figure 2. Microscopical images of the healing abutments
- Figure 3. Representative SEM images of healing abutments