Figure 2. Cumulative implant survival over the follow-up period. The Kaplan-Meyer diagram visualises the analysis of implant survival in the maxilla and in the mandible (log rank test, p = 0.173) over the follow-up period up to 37 months (Table 4)
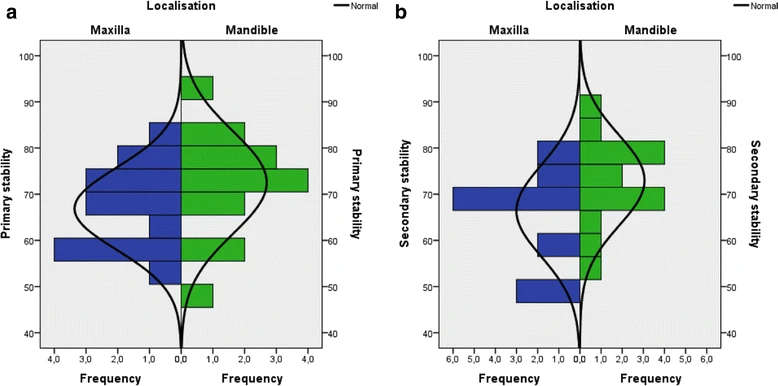
Figure 3. a Primary implant stability
author: Waldemar Reich,Ramona Schweyen,Christian Heinzelmann,Jeremias Hey,Bilal Al-Nawas, Alexander Walter Eckert | publisher: drg. Andreas Tjandra, Sp. Perio, FISID

Serial posts:
- Novel expandable short dental implants with reduced vertical bone height
- Introduction : Novel expandable short dental implants (1)
- Introduction : Novel expandable short dental implants (2)
- Material & methods : Novel expandable short dental implants (1)
- Material & methods : Novel expandable short dental implants (2)
- Results : Novel expandable short dental implants (2)
- Discussion : Novel expandable short dental implants (1)
- Discussion : Novel expandable short dental implants (2)
- Discussion : Novel expandable short dental implants (3)
- Discussion : Novel expandable short dental implants (4)
- Discussion : Novel expandable short dental implants (5)
- Table 1 Patient recruitment
- Table 2 Surgical treatment protocol
- Table 3 Prosthetic treatment protocol
- Table 4 Clinical characteristics of the study cohort
- Figure 1. a Closed short expandable dental implant
- Figure 2. Cumulative implant survival over the follow-up period
- Figure 3. a Primary implant stability
- Figure 4 a–h Prosthetic restauration—follow-up examination. Intraoral and perioral views of a rehabilitated female patient. (She asked explicitly only for implantological treatment in the mandible.)
- Figure 5 Postoperative orthopantomogram