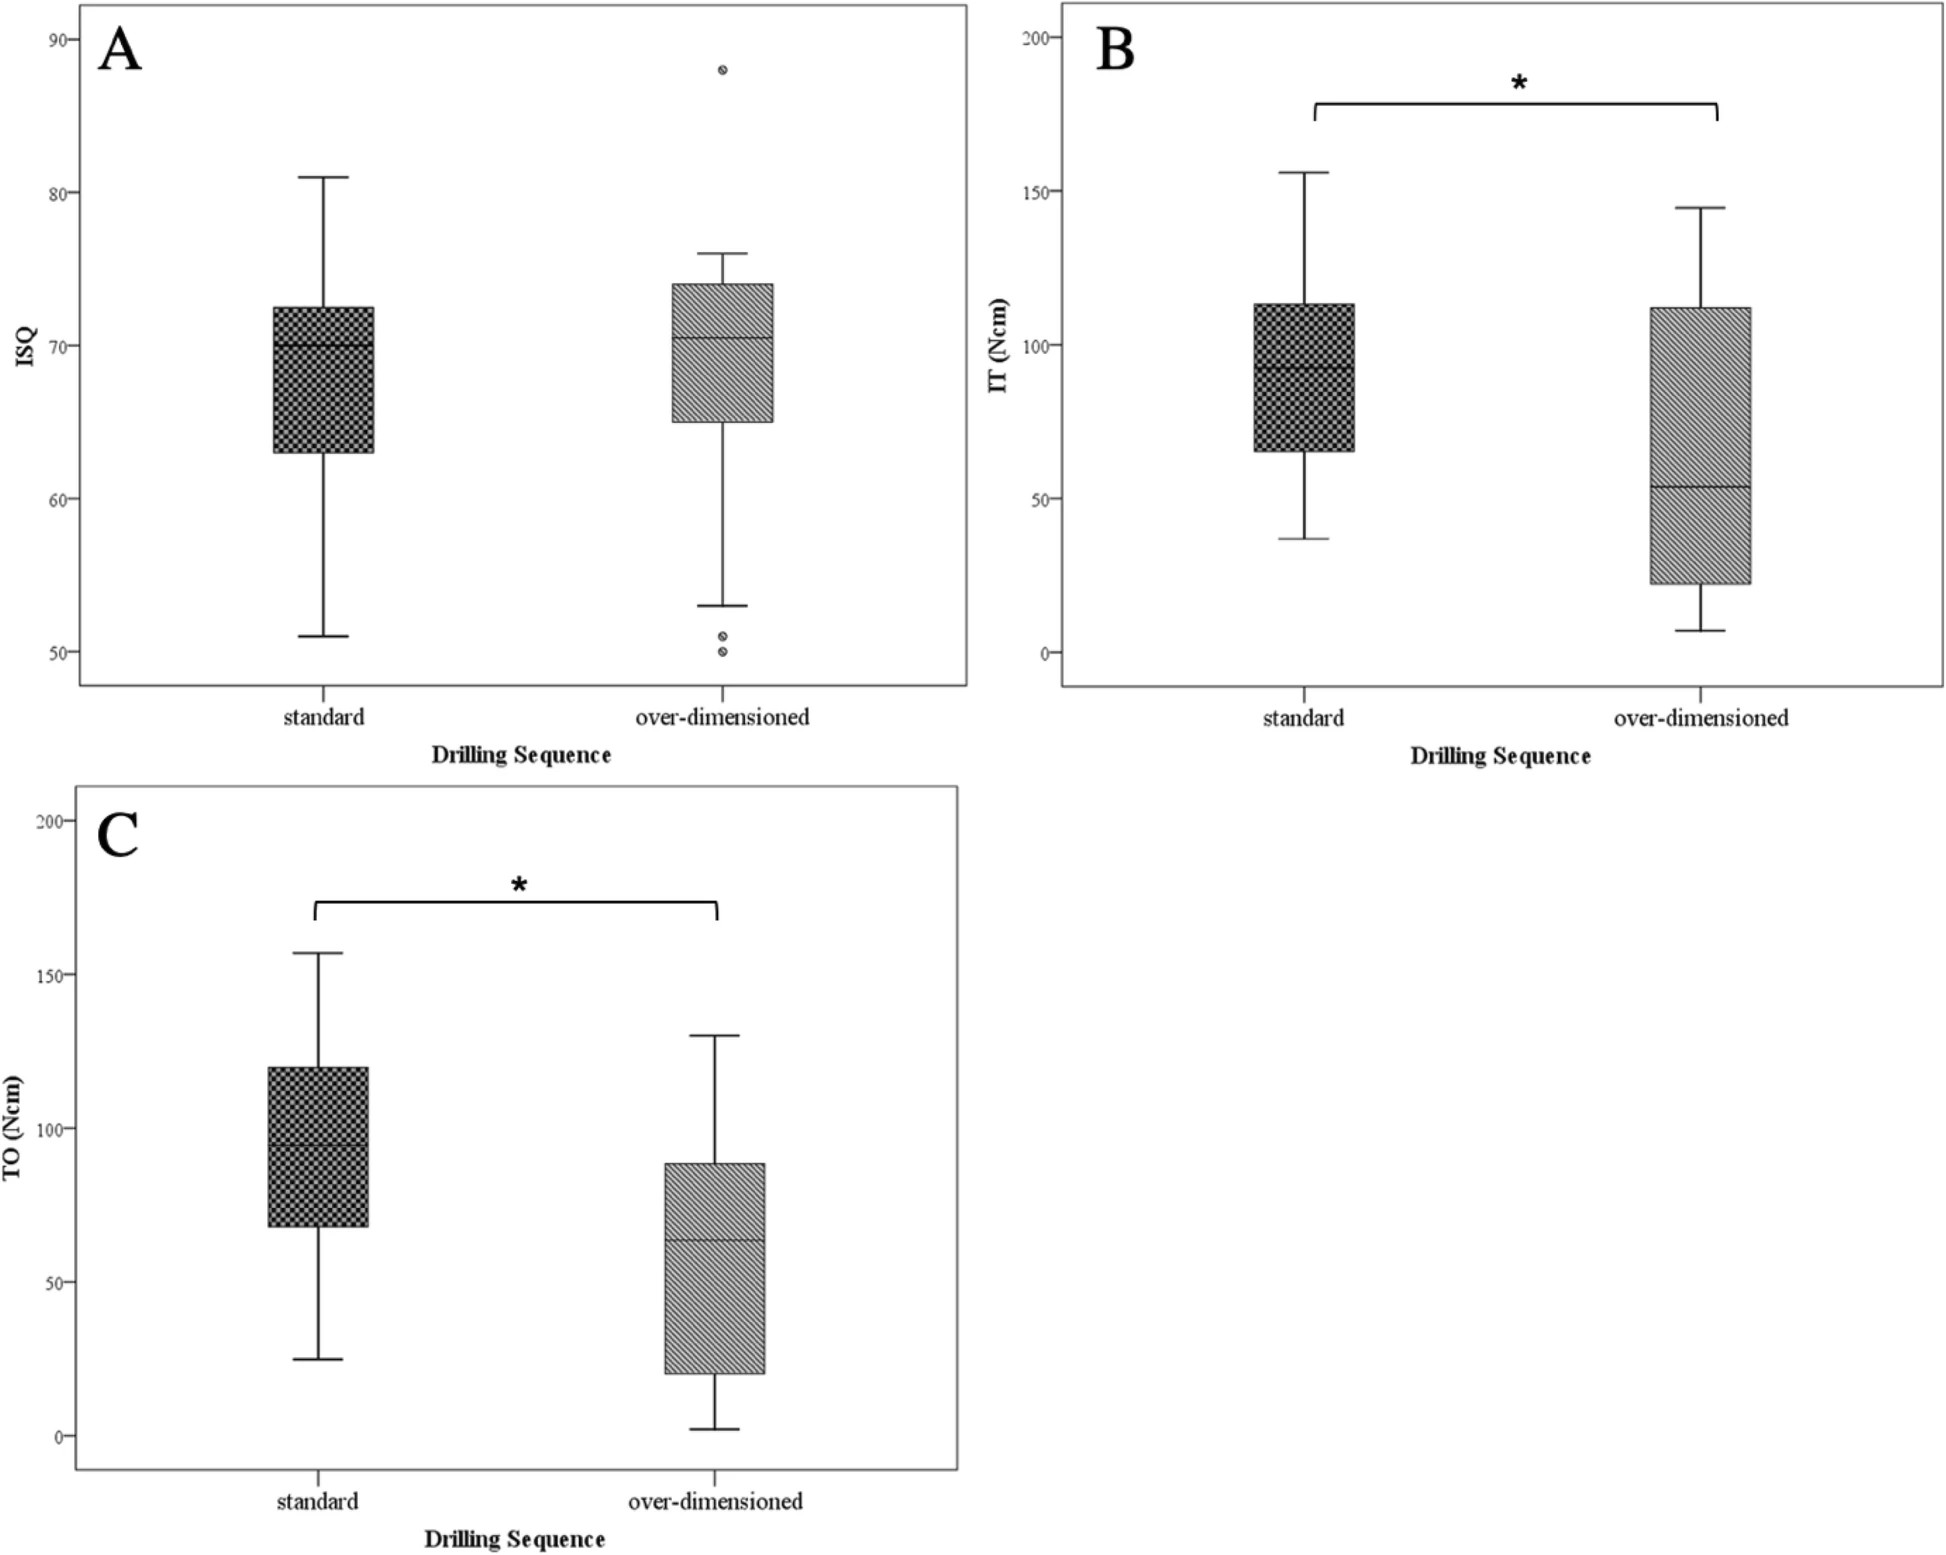
Figure 3. Comparison of standard and over-dimensioned protocol. The figure displayed shows the comparison between standard and over-dimensioned protocol. a Displays the measurements obtained by RFA.
Figure 3. Comparison of standard and over-dimensioned protocol
author: Henning Staedt,Peer W Kmmerer,Elisabeth Goetze,Daniel G E Thiem,Bilal Al-Nawas, Diana Heimes | publisher: drg. Andreas Tjandra, Sp. Perio, FISID

Serial posts:
- Implant primary stability depending on protocol and insertion mode — an ex vivo study
- Background : Implant primary stability depending on protocol and insertion mode (1)
- Background : Implant primary stability depending on protocol and insertion mode (2)
- Background : Implant primary stability depending on protocol and insertion mode (3)
- Methods : Implant primary stability depending on protocol and insertion mode (1)
- Methods : Implant primary stability depending on protocol and insertion mode (2)
- Results : Implant primary stability depending on protocol and insertion mode
- Discussion : Implant primary stability depending on protocol and insertion mode (1)
- Discussion : Implant primary stability depending on protocol and insertion mode (2)
- Discussion : Implant primary stability depending on protocol and insertion mode (3)
- Table 1 Comparison of standard and over-dimensioned protocol
- Table 2 Comparison of manual and machine-driven insertion mode
- Table 4 Comparison of implant length
- Table 3 Comparison of implant diameter
- Figure 1. Implant types and drilling protocol
- Figure 2. Over-dimensioned protocol
- Figure 3. Comparison of standard and over-dimensioned protocol