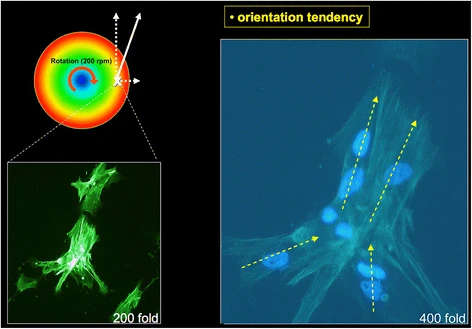
Figure 5. Osteoblasts with an orientation tendency after 24 h of rotation (phallacidin fluorescence staining). On the left side with 200× and on the right side with 400× magnification. The yellow arrows show the orientation of the cells. The red arched arrow within the coloured circle shows the direction of rotation. The dashed white line oriented to the right stands for the resulting centrifugal force. The dashed white line pointing upwards shows the direction of the resulting flow resistance. The solid white arrow stands for the vectorial sum of the abovementioned forces
Figure 5. Osteoblasts with an orientation tendency after 24 h
author: P W Kmmerer,D G E Thiem,A Alshihri,G H Wittstock,R Bader,B Al-Nawas, M O Klein | publisher: drg. Andreas Tjandra, Sp. Perio, FISID

Serial posts:
- Cellular fluid shear stress on implant surfaces
- Methods : Cellular fluid shear stress on implant surfaces (1)
- Methods : Cellular fluid shear stress on implant surfaces (2)
- Methods : Cellular fluid shear stress on implant surfaces (3)
- Results : Cellular fluid shear stress on implant surfaces (1)
- Results : Cellular fluid shear stress on implant surfaces (2)
- Discussion : Cellular fluid shear stress on implant surfaces (1)
- Discussion : Cellular fluid shear stress on implant surfaces (2)
- Discussion : Cellular fluid shear stress on implant surfaces (3)
- Discussion : Cellular fluid shear stress on implant surfaces (4)
- References : Cellular fluid shear stress on implant surfaces
- Figure 1. Three-dimensional illustration and photography
- Figure 2. Side view of a computerized simulation
- Figure 3. Diagram for visualisation of the calculation of shear stress rates
- Figure 4. Randomly orientated osteoblasts without influence of rotation
- Figure 5. Osteoblasts with an orientation tendency after 24 h