Methods : Cellular fluid shear stress on implant surfaces (2)
Analytical formula for evaluating the flow characteristics
Frequently used flow chambers are characterised by an internal fluid flow along a stationary cell-bearing surface, whereas the osteoblast test cells of this newly developed model are circulating within a resting culture medium.
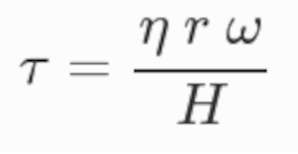
For constant and fully developed laminar flow between the two parallel plates, the magnitude of the wall shear stress (τ) in between was calculated by formula 1 in which η is the dynamic fluid viscosity (dyn/cm2), r is the radius of the plate (cm), ω stands for angular velocity and H for height (vertical distance in between the two plates).

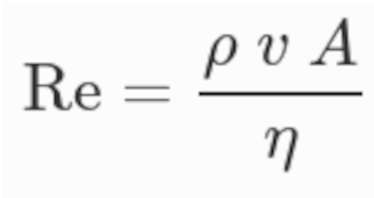
To get information whether the flow is laminar or turbulent, Reynolds numbers (Re) were calculated for all flow regimes using formula 2.

in which ρ is the liquids’ density, η is its dynamic viscosity, v stands for average angular velocity and A is the characteristic area within which liquids flow (vertical distance between the two plates). Re values of >1500 are commonly considered illustrative of turbulent flow as well as values <1500 create laminar flows.
Computational simulation of the flow characteristics
Numerous computerised simulations were performed to verify flow characteristics occurring within the plate/plate flow chamber assisted by the Department of Hydraulic Machines, Faculty of Mechanical Engineering, Technical University of Munich, Germany. For simulation of flow profiles to assess a potential cellular impact by fluid shear stress inside the chamber, graphical illustrations were created by using Ansys CFX® software (Ansys Germany GmbH, Otterfing, Germany).
Serial posts:
- Cellular fluid shear stress on implant surfaces
- Methods : Cellular fluid shear stress on implant surfaces (1)
- Methods : Cellular fluid shear stress on implant surfaces (2)
- Methods : Cellular fluid shear stress on implant surfaces (3)
- Results : Cellular fluid shear stress on implant surfaces (1)
- Results : Cellular fluid shear stress on implant surfaces (2)
- Discussion : Cellular fluid shear stress on implant surfaces (1)
- Discussion : Cellular fluid shear stress on implant surfaces (2)
- Discussion : Cellular fluid shear stress on implant surfaces (3)
- Discussion : Cellular fluid shear stress on implant surfaces (4)
- References : Cellular fluid shear stress on implant surfaces
- Figure 1. Three-dimensional illustration and photography
- Figure 2. Side view of a computerized simulation
- Figure 3. Diagram for visualisation of the calculation of shear stress rates
- Figure 4. Randomly orientated osteoblasts without influence of rotation
- Figure 5. Osteoblasts with an orientation tendency after 24 h