Material and Methods: Advanced Platelet-Rich Fibrin
Production of Choukroun's PRF
The PRF scaffolds were prepared according to a previously published protocol.11,26 Four healthy (ie, with no history of anticoagulant usage) volunteers in an age range between 18 to 60 years participated in this study. For each individual, 4 tubes of peripheral blood were collected and immediately placed in a preprogrammed centrifuge (PC-O2, PROCESS for PRF, Nice, France). Centrifugation was performed according to the following two protocols: (1) standard PRF, sterile glass coated plastic tube (9 mL; 2700 rpm for 12 minutes) and (2) advanced PRF, sterile plain glass-based vacuum tubes (A-PRF10 tube) (10 mL; 1500 rpm for 14 minutes).
Histological preparation
Tissue Processing
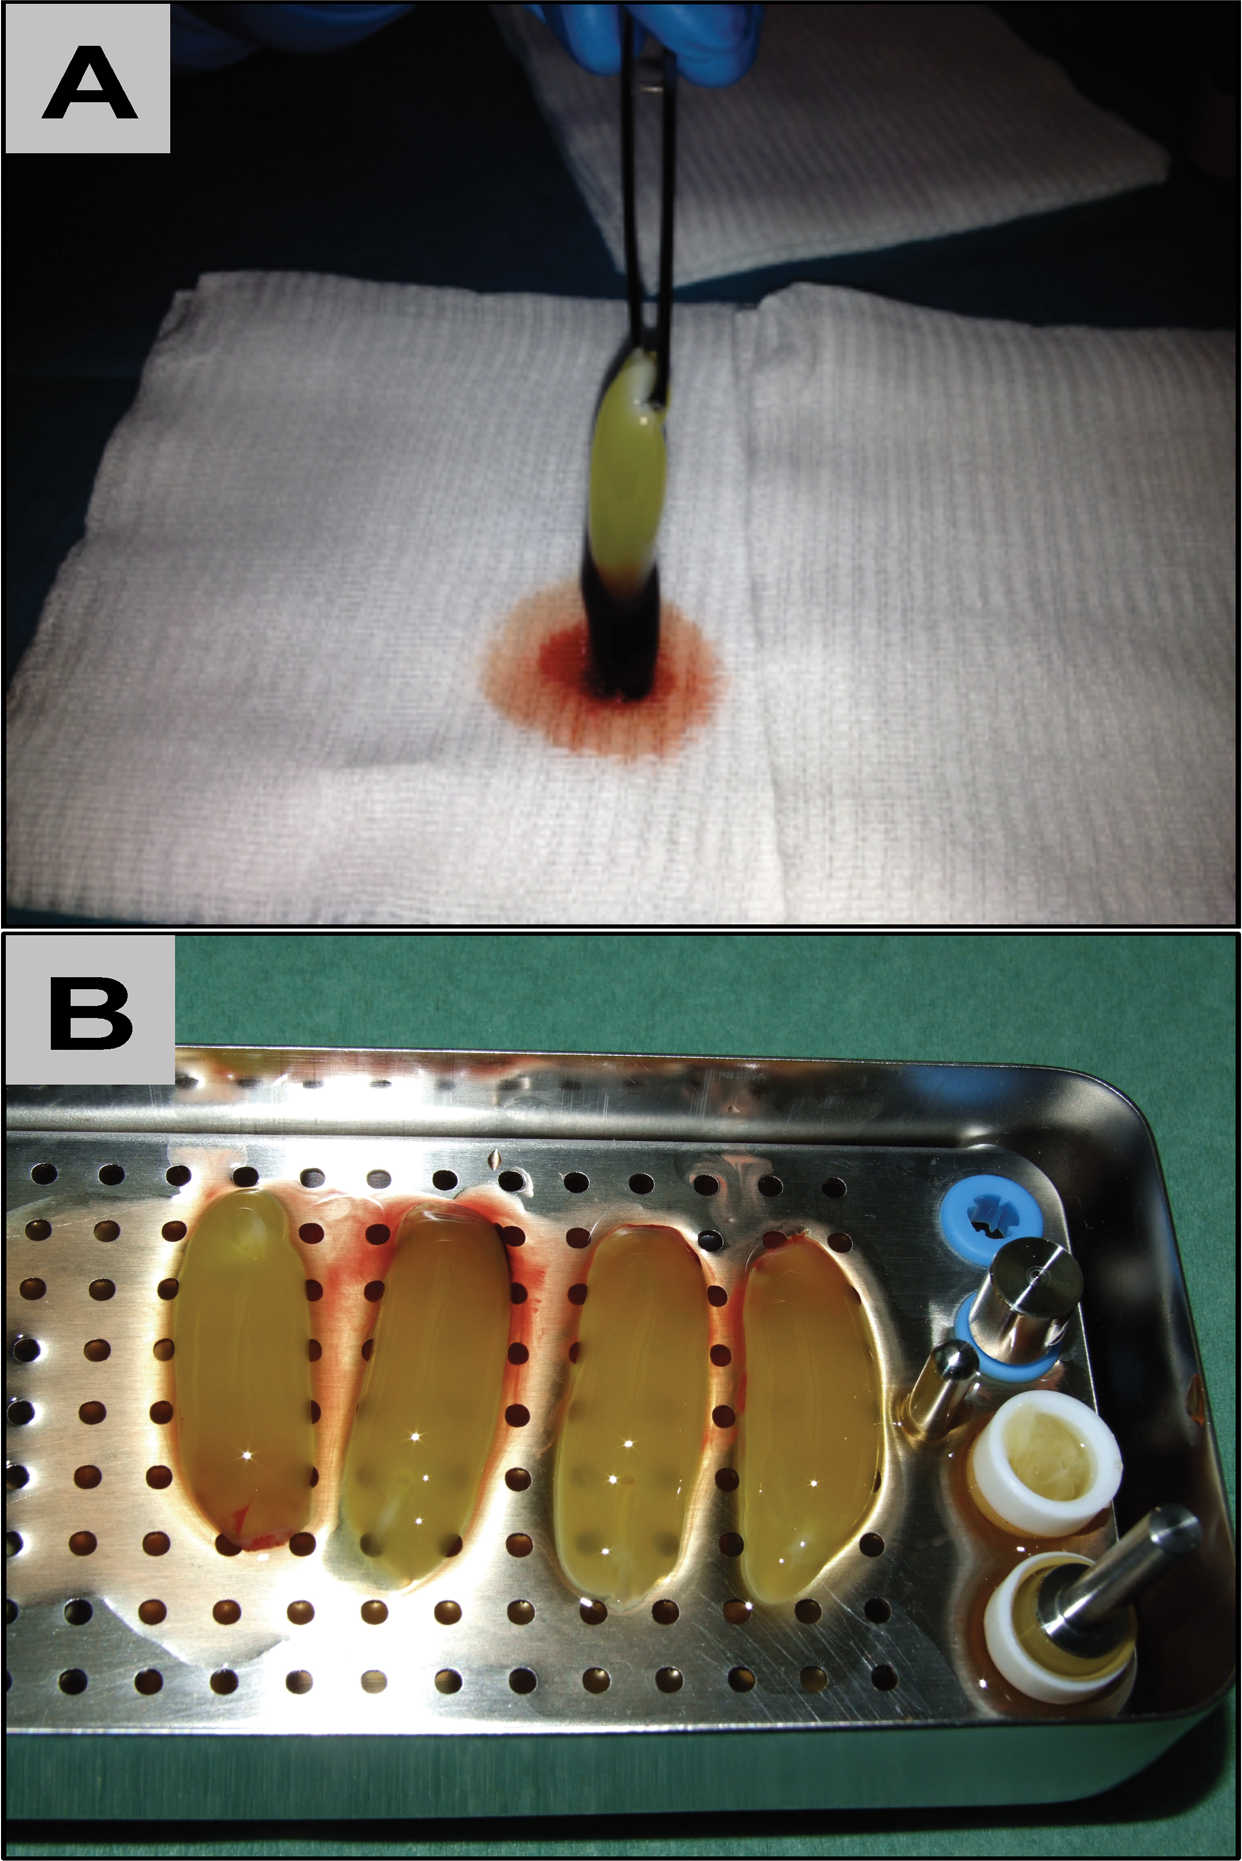
After centrifugation, the clots were carefully retrieved from the tubes. The red blood cell (RBC) fraction was removed in such a manner that the bottom of the fibrin-rich clot was not damaged. This technique is described in more detail in the Choukroun protocol.11,26 An impression about the shape of the clot is given in Figure 1. Fibrin-based clots with the buffy coat (BC) and part of the RBC were subsequently fixed with 4% paraformaldehyde solution for 24 hours. After that, they were cut and placed along the longitudinal axis into embedding cassettes.

Histology and Histochemistry
For further microscopic analysis, the samples were chemically processed in an alcohol series and xylene as previously described.1,2 Subsequently, paraffin embedding was performed, and 10 sections of 2 to 4 μm thickness, were cut with a rotary microtome (Leica RM2255, Wetzlar, Germany) and affixed on charged glass slides (SuperFrost Plus, Thermo Scientific, Waltham, Mass). Before staining, samples underwent a deparaffinization and rehydratation process by sequential immersion in xylene followed by descending concentrations of ethanol. Several histochemical and immunohistochemical staining methods were then performed, as described as follows:
Three samples were histologically stained with standard protocols for hematoxylin and eosin (H&E) and Masson-Goldner's trichome technique, as these special histochemical staining methods allowed discrimination of the components of the clots, that is, between cells and matrix proteins such as fibrin.1,2 The other six sections were used to identify various markers (Table) by means of immunohistochemical staining in an autostainer (DAKO, Hamburg, Germany) at the Institute of Pathology, Johann Wolfgang Goethe University Frankfurt, Germany.
| Type | |||||
|---|---|---|---|---|---|
| Antibody | Targeted cell | Clone | (mono or poly) | Epitope demasking | Concentration |
| Anti-CD3 | T-lymphocytes | - | Polyclonal rabbit anti-human |
Tris-EDTA, pH 8.0 | 1:200 |
| Anti-CD15, in accordance to reference | Neutrophilic granulocytes | Carb-3 | Monoclonal mouse anti-human |
Tris-EDTA, pH 8.0 | RTU |
| Anti-CD20cy | B-lymphocytes | Clone 126 | Monoclonal mouse anti-human |
Tris-EDTA, pH 8.0 | 1:1000 |
| Anti-CD34 class II | Stem cells | Clone QBend-10 |
Monoclonal mouse anti-human |
Tris-EDTA, pH 8.0 | RTU |
| Anti-CD61 platelet glycoprotein lila | Platelets | Y2/51 | Monoclonal mouse anti-human |
Tris-EDTA, pH 8.0 | 1:500 |
| Anti-CD68 | Monocyte | KP1 | Monoclonal mouse anti-human |
Tris-EDTA, pH 8.0 | RTU |
Immunohistochemistry
After establishing the optimal antibody concentration for each of the above-mentioned markers (DAKO), the slides were placed in a rack and incubated in Tris-EDTA pH 8.0 at 96°C for 20 minutes. Subsequently, the slides were rinsed with running tap water to cool. Then, the slides were washed with TBS and transferred to the autostainer. Before starting the autostainer, the required antibodies and solutions were loaded into the autostainer according to the manufacturer's instructions. The DAKO EnVision detection system was used. After autostaining, the slides were counterstained with hemalun for 30 seconds and washed with running tap water. Finally, the stained slides were cover-slipped with Aquatex water-based, mounting medium (Merck, Germany).
Histological evaluation
Histological examination was performed using a light microscope (Nikon Eclipse 80i, Tokyo, Japan). High-resolution photographs were taken with a connected Nikon DS-Fi1/Digital camera and a Nikon Digital sight unit DS-L2.
Histomorphometry
For histomorphometrical analysis, the six immunohistochemically stained slides of each clot were scanned by means of a Nikon Eclipse 80i microscope fitted with an automatic scanning table (Prior Scientific, Rockland, Maine), a Nikon DS-Fi/1 digital camera and a computer with the Nikon NIS – Elements AR software, version 4.0. This combination allowed the capture of single high-resolution images and subsequent assembly of single images to one complete image (ie, a “total scan”).
The following histomorphometrical analyses of the comparative cell penetration within the clots were done also using the measurement function of the NIS – Elements software. Therefore, the total length of every clot was measured at first (in micrometer), and after that, the “penetration” lengths of the following cell types were also determined (in micrometer): stem cells, T- and B-lymphocytes, neutrophilic granulocytes, platelets, and monocytes. Finally, the distribution of the different cell types was put into context within the respective clot length, thus allowing expression of the “penetration” lengths in percent (ie, “relative cell penetration”) for the subsequent statistical comparisons.
Statistical evaluation
Statistical analysis was carried out by using the data of the two different experimental groups (ie, with n = 4 samples in each group). Penetration depths were then compared statistically. The obtained data yielded a mean ± S.E.M. with the aid of 1-way analysis of variance and a Bonferroni multiple comparisons post-hoc test via the GraphPad Prism version 6.0 (GraphPad Software, La Jolla, Calif). Thereby, inter-individual as well as intra-individual statistical significance were reported as significant (•/*, respectively) at P < .05, and as highly significant (••/**) at P < .01 and (•••/***) at P < .001. Finally, the quantitative data were presented graphically as the mean ± standard deviation (SD).