Open hour: senin - sabtu 09:00:00 - 20:00:00; minggu & tanggal merah tutup
The aim of the study was to assess histologically and histomorphometrically the cell distribution pattern of fibrin clots by applying the standard PRF (S-PRF) protocol with 12-minute centrifugation time and 2700 rpm as well as the new advanced PRF (A-PRF) protocol with 14-minute centrifugation time and 1500 rpm.

Results: Advanced Platelet-Rich Fibrin

author: Shahram Ghanaati, MD, DMDPatrick Booms, PhDAnna Orlowska, BSc, DVMAlica KubeschJonas Lorenz, DDSJim Rutkowski, DMD, PhDConstanti | publisher: drg. Andreas Tjandra, Sp. Perio, FISID

Results

Histochemical studies (H&E, Mason-Goldner, and Giemsa)

S-PRF

In the longitudinal section of the S-PRF clot, produced according to the standard centrifugation protocol (2700 rpm, 12 minutes), a dense fibrin clot was seen with minimal interfibrous space. With the standard histochemical staining methods, cells were observed throughout the clot, albeit decreasing toward the more distal parts of the PRF clot (data not shown).

A-PRF

PRF clots formed with the A-PRF centrifugation protocol (1500 rpm, 14 minutes) showed a looser structure with more interfibrous space, and more cells could be counted in the fibrin-rich clot. Furthermore, the cells were more evenly distributed throughout the clot as compared to S-PRF, and some cells could be found even in the clot's more distal parts. A representative image for cell distribution within A-PRF is given in Figure 2.
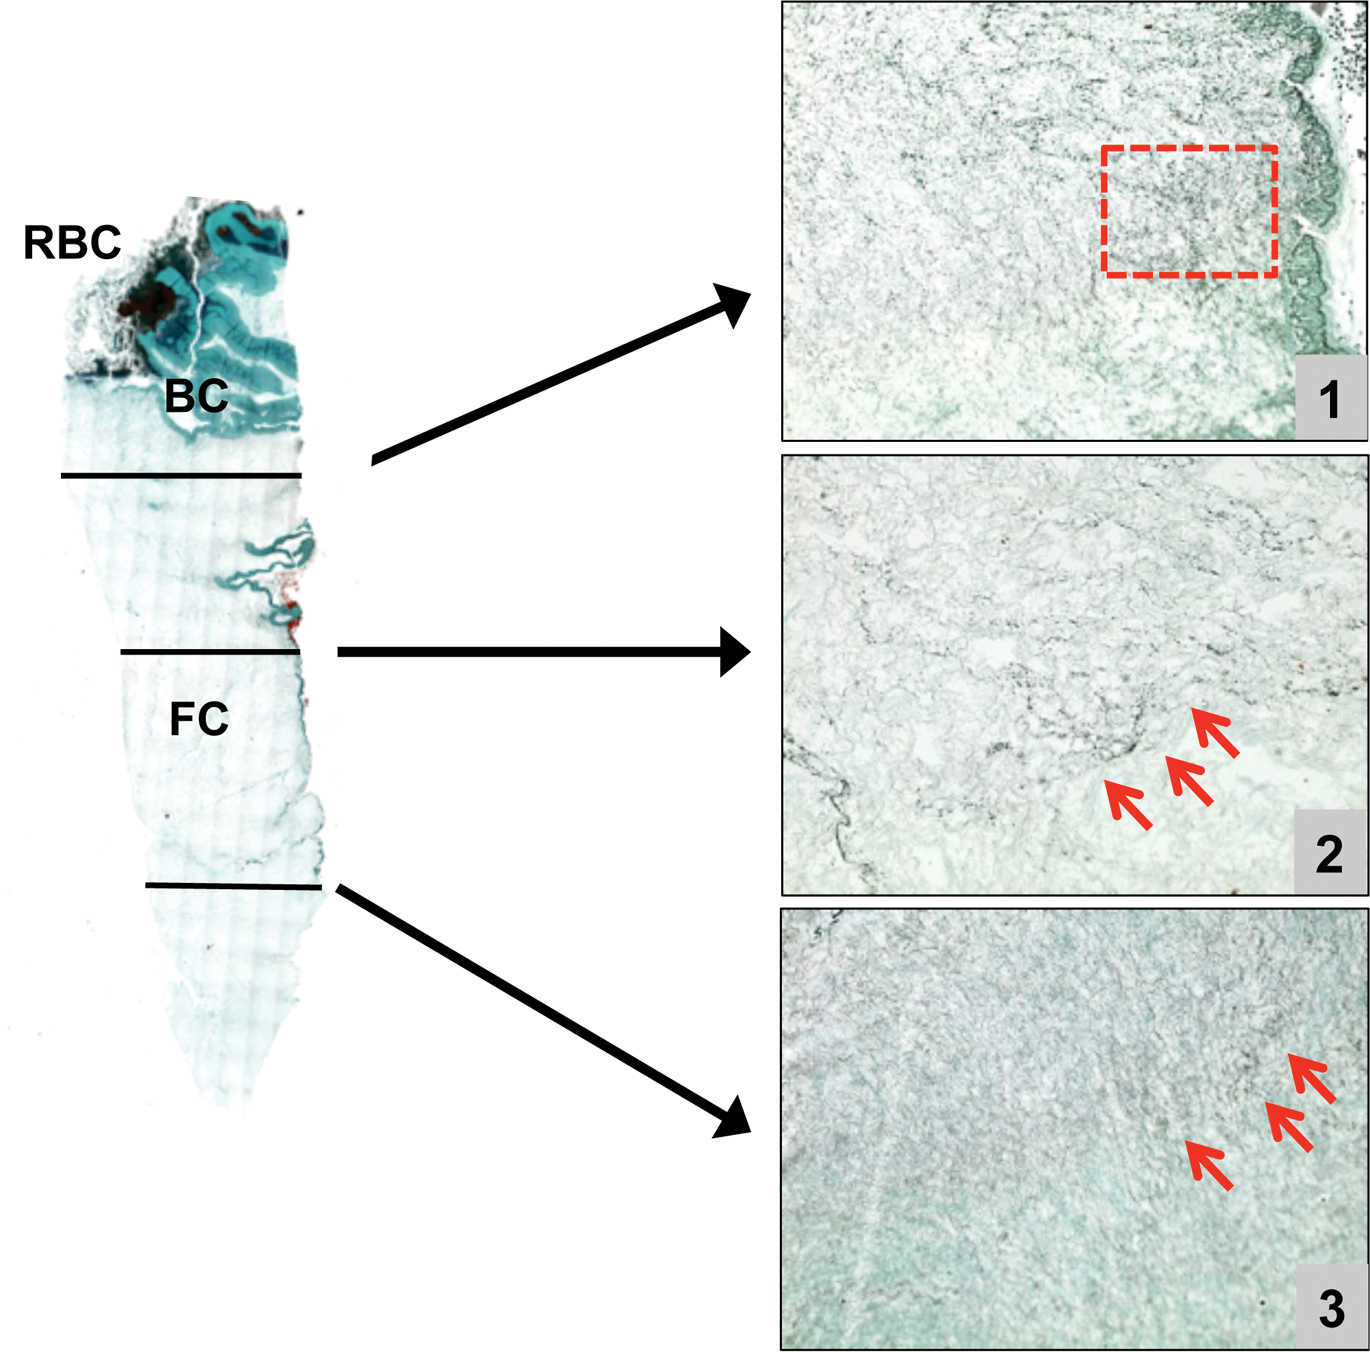
Total scan of a fibrin clot along its longitudinal axis (Masson-Goldner staining). RBC represents the red blood cell fraction. The buffy coat (BC) is the transformation zone between the RBC fraction and fibrin clot, and FC represents the fibrin clot. The three bars within the scan and the arrows show close-ups of the respective areas. The red arrows mark cells that are entrapped within the fibrin network.
Figure 2. Total scan of a fibrin clot along its longitudinal axis (Masson-Goldner staining). RBC represents the red blood cell fraction. The buffy coat (BC) is the transformation zone between the RBC fraction and fibrin clot, and FC represents the fibrin clot. The three bars within the scan and the arrows show close-ups of the respective areas. The red arrows mark cells that are entrapped within the fibrin network.

Descriptive immunohistochemical evaluation

S-PRF

The slides stained for the respective markers were evaluated in terms of specific cell type distribution (Figures 3 and 4). In general, the highest number of positively labeled cells was present in close proximity to the RBC or in the BC. In particular, cells with positive immunolabeling—including T-lymphocytes (CD3-positive cells), B-lymphocytes (CD20-positive cells), stem cells (CD34-positive cells), and monocytes (CD68-positive cells)—were found at the transition zone of the RBC fraction, BC, and proximal parts of the clot. The platelets (CD61-positive cells) were distributed throughout the clot. However, decreased numbers were observed from the proximal (near the BC) to the distal part of the S-PRF clot. Additionally, neutrophilic granulocytes (CD15-positive) showed a tendency to accumulate mainly in the RBC-BC clot interface.
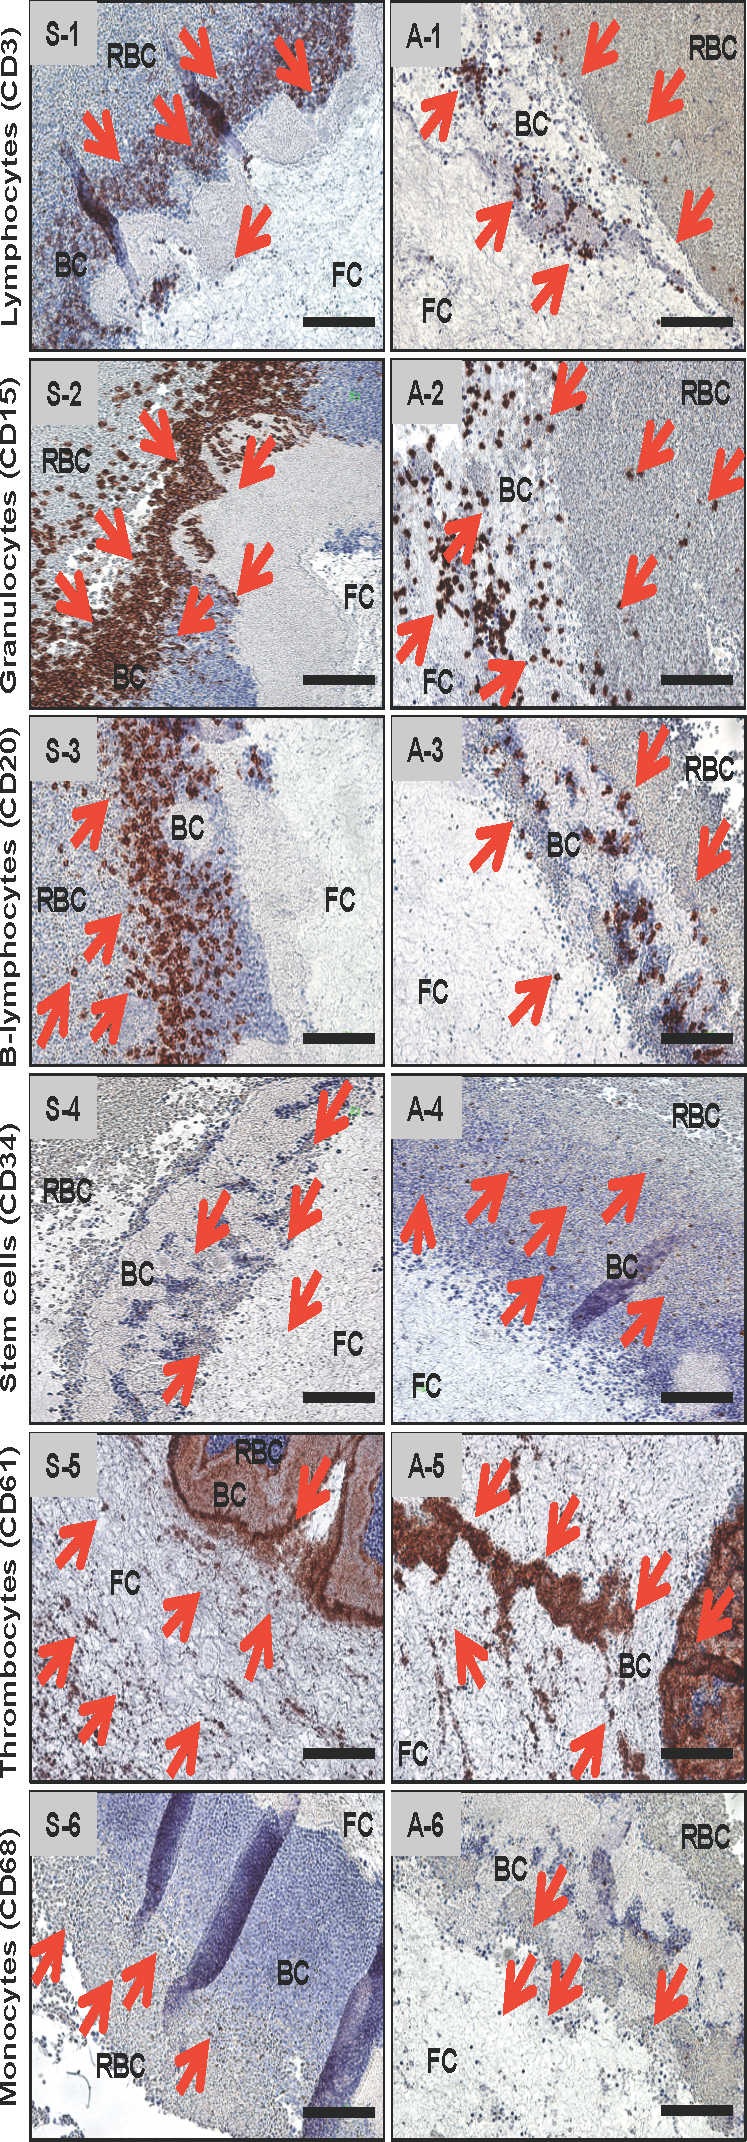
Immunohistochemical reaction of the cells detected within the clots of the two experimental groups. Images S1–S6 show close-ups of the transformation zone between red blood cell (RBC), buffy coat (BC), and fibrin clot (FC) with different immunohistochemical staining for CD 3-, CD15-, CD20-, CD34-, CD61-, and CD68-positive cells in the respective picture for platelet-rich fibrin (PRF) clots produced with the standard PRF protocol. As can be seen in the different images, the stained cells are mainly located within the border between the RBC count and the BC. Depending on the immunohistochemical marker, the cells are more or less prominent in the PRF clot. The red arrows mark the cells stained cells (positive) within the respective picture. The same applies for the Figure A1 through A6. These images are taken from PRF clots produced with the advanced PRF protocol.
Figure 3. Immunohistochemical reaction of the cells detected within the clots of the two experimental groups. Images S1–S6 show close-ups of the transformation zone between red blood cell (RBC), buffy coat (BC), and fibrin clot (FC) with different immunohistochemical staining for CD 3-, CD15-, CD20-, CD34-, CD61-, and CD68-positive cells in the respective picture for platelet-rich fibrin (PRF) clots produced with the standard PRF protocol. As can be seen in the different images, the stained cells are mainly located within the border between the RBC count and the BC. Depending on the immunohistochemical marker, the cells are more or less prominent in the PRF clot. The red arrows mark the cells stained cells (positive) within the respective picture. The same applies for the Figure A1 through A6. These images are taken from PRF clots produced with the advanced PRF protocol.


A-PRF

Analogous to the S-PRF, slides were stained immunohistochemically for the markers of interest (Figures 3 and 4). Most of the CD3-, CD20-, CD34-, and CD68-positive cells stained in or near the BC (ie, the very proximal part of the fibrin clot); however, the BC was more extensive in comparison to S-PRF. Additionally, the neutrophilic granulocytes (ie, CD15-positive cells) were distributed more widely toward the distal (ie, away from the BC) part of the fibrin-clot. Approximately two-thirds of the clot was seeded with neutrophilic granulocytes/CD15-positive cells, with only the last third (distal part of the fibrin clot) spared. As has been observed in the S-PRF group, platelets (ie, CD61-positive) were found throughout the entire clot. When compared to the S-PRF group, the amount of CD61-positive cells did not decrease to the same extent in the periphery.
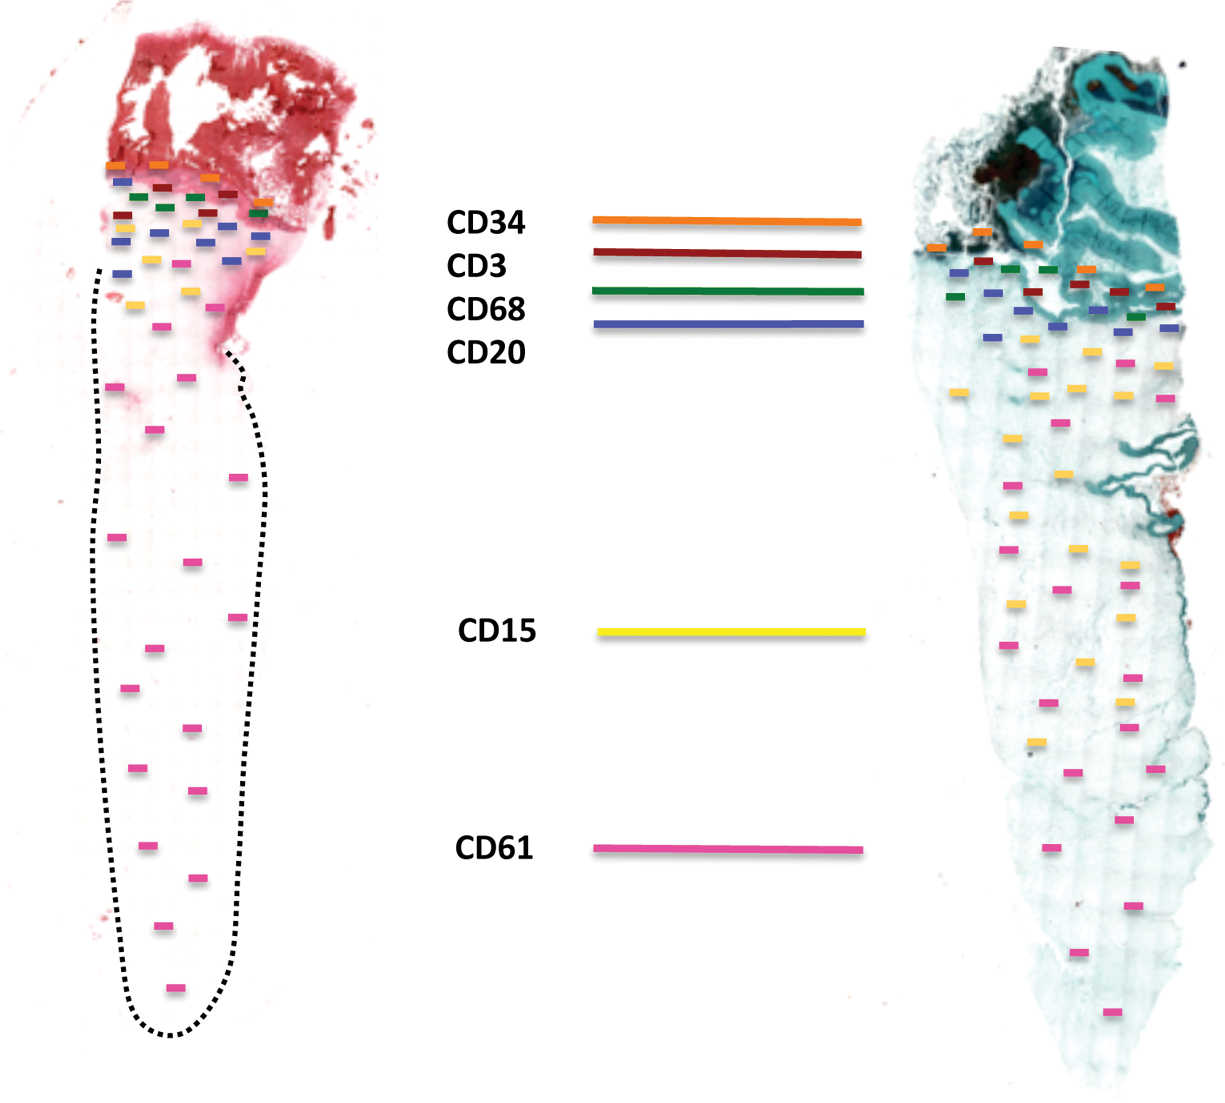
Two total scans of the standard platelet-rich fibrin (PRF): left, hematoxylin and eosin (H&E) staining, total scan, 100 × magnification, and the advanced PRF; right, Masson-Goldner staining, total scan, 100 × magnification. Between both total scans, each immunohistochemical marker is portrayed by a colored bar (CD34–CD61). Within each of the total scans, the distribution of each cell type is depicted by separately colored bars. By looking at the total scans of both the standard and advanced PRF, it becomes apparent that CD61-positive cells (platelets) are distributed evenly throughout the clot, although the amount of platelets appears to decrease toward the peripheral parts of the clot in the S-PRF group. Additionally, the modification of the protocol resulted in an increased migration of CD15-positive cells into the A-PRF clot.
Figure 4. Two total scans of the standard platelet-rich fibrin (PRF): left, hematoxylin and eosin (H&E) staining, total scan, 100 × magnification, and the advanced PRF; right, Masson-Goldner staining, total scan, 100 × magnification. Between both total scans, each immunohistochemical marker is portrayed by a colored bar (CD34–CD61). Within each of the total scans, the distribution of each cell type is depicted by separately colored bars. By looking at the total scans of both the standard and advanced PRF, it becomes apparent that CD61-positive cells (platelets) are distributed evenly throughout the clot, although the amount of platelets appears to decrease toward the peripheral parts of the clot in the S-PRF group. Additionally, the modification of the protocol resulted in an increased migration of CD15-positive cells into the A-PRF clot.

Quantitative histomorphometric analysis of cell penetration

The histomorphometrical analysis of the total scans permitted an evaluation and comparison of the respective cell distribution in the PRF clots. The total length of each clot was measured and a mean of ± SEM was calculated. The distribution/allocation of each cell type was evaluated in the corresponding total scan of the immunohistochemical staining. The analyses revealed that platelets were the only ones found in each area of the clot up to 87 ± 13% in the S-PRF group and up to 84 ± 16% in the A-PRF group (Figure 5). Furthermore, the results showed that T-lymphocytes (S-PRF: 12 ± 5%, A-PRF: 17 ± 9%), B-lymphocytes (S-PRF: 14 ± 7%, A-PRF: 12 ± 9%), CD34-positive stem cells (S-PRF: 17 ± 6%, A-PRF: 21 ± 11%), and monocytes (S-PRF: 19 ± 9%, A-PRF: 22 ± 8%) were not found beyond a certain point of maximally 30% of the total clot length, as they are distributed in or near the BC generated by the centrifugation process (Figure 5). Statistical analysis revealed no statistically significant differences between the values of the two groups concerning the allocation of these cell types (Figure 5). It is a remarkable observation that the changes in parameters in PRF centrifugation protocols result in an increased cell distribution of neutrophilic granulocytes up to 68 ± 24% of the scaffold within the A-PRF group, while this cell type was located up to 25 ± 12% of the clot length in the S-PRF group (Figure 5). In this case, statistical analysis showed a highly significant difference regarding the “distribution” depth of this cell type between both study groups (**P < .01) (Figure 5).
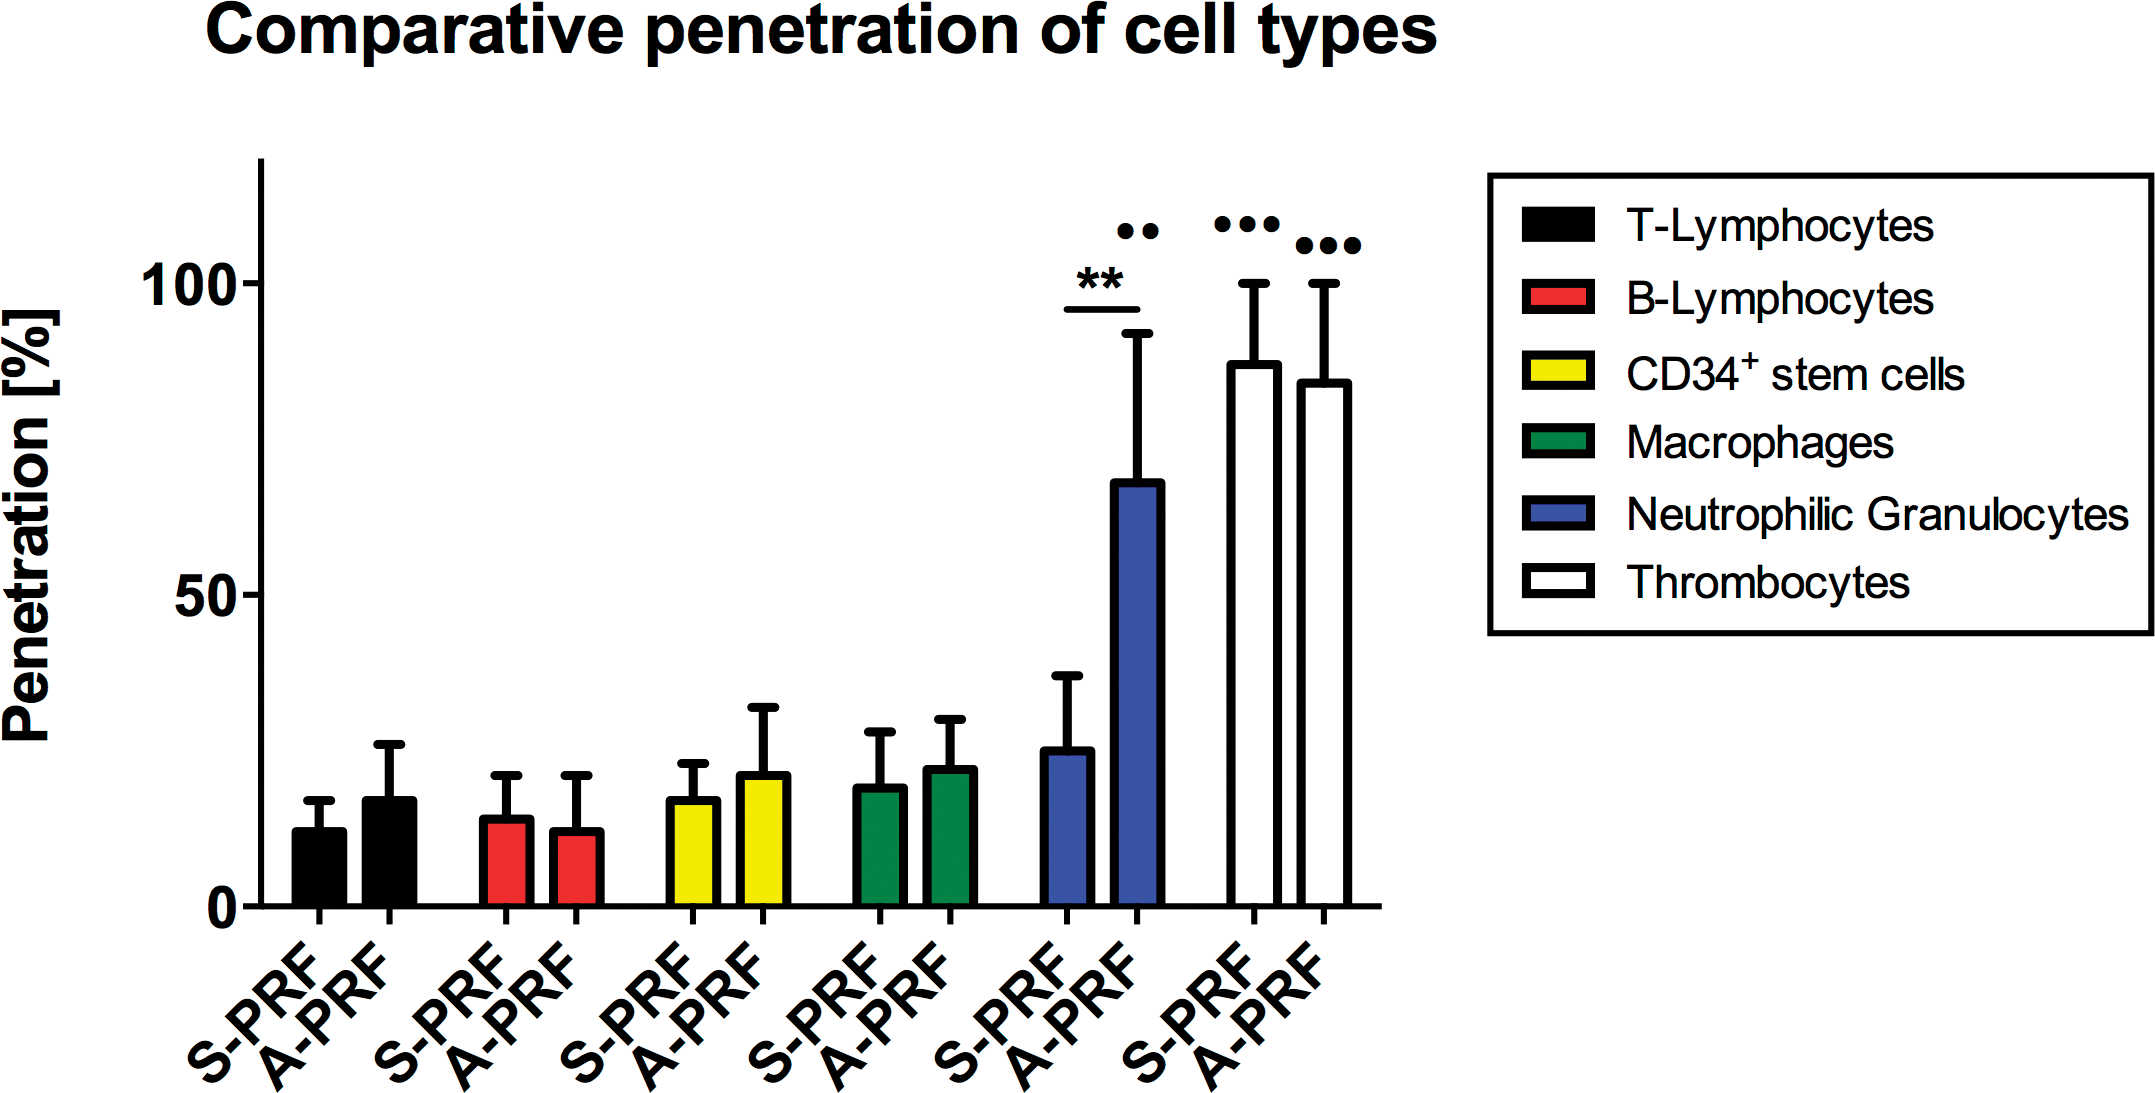
Comparative penetration of the different cell types into the clot for both the standard platelet-rich fibrin (S-PRF) and advanced platelet-rich fibrin (A-PRF). As can be seen in this diagram, a highly significant difference (**P < .01) in distribution was established for neutrophilic granulocytes (CD15) between both groups.
Figure 4. Comparative penetration of the different cell types into the clot for both the standard platelet-rich fibrin (S-PRF) and advanced platelet-rich fibrin (A-PRF). As can be seen in this diagram, a highly significant difference (**P < .01) in distribution was established for neutrophilic granulocytes (CD15) between both groups.

Additionally, no significant differences in the distribution depths between the platelets, T- lymphocytes, B-lymphocytes, stem cells, and monocytes were found when comparing the two centrifugation steps (Figure 5). Furthermore, the analyses showed that the distribution depth of the neutrophilic granulocytes in the A-PRF group was highly increased compared to the before-mentioned cell types (**P < .01), while no interindividual differences were found in the S-PRF group between these cell types (Figure 5). Finally, the distribution depths of the platelets were significantly higher compared to the values of all other cell types in both study groups (***P < .001) (Figure 5).


Serial posts:


id post:
New thoughts
Me:
search
glossary
en in