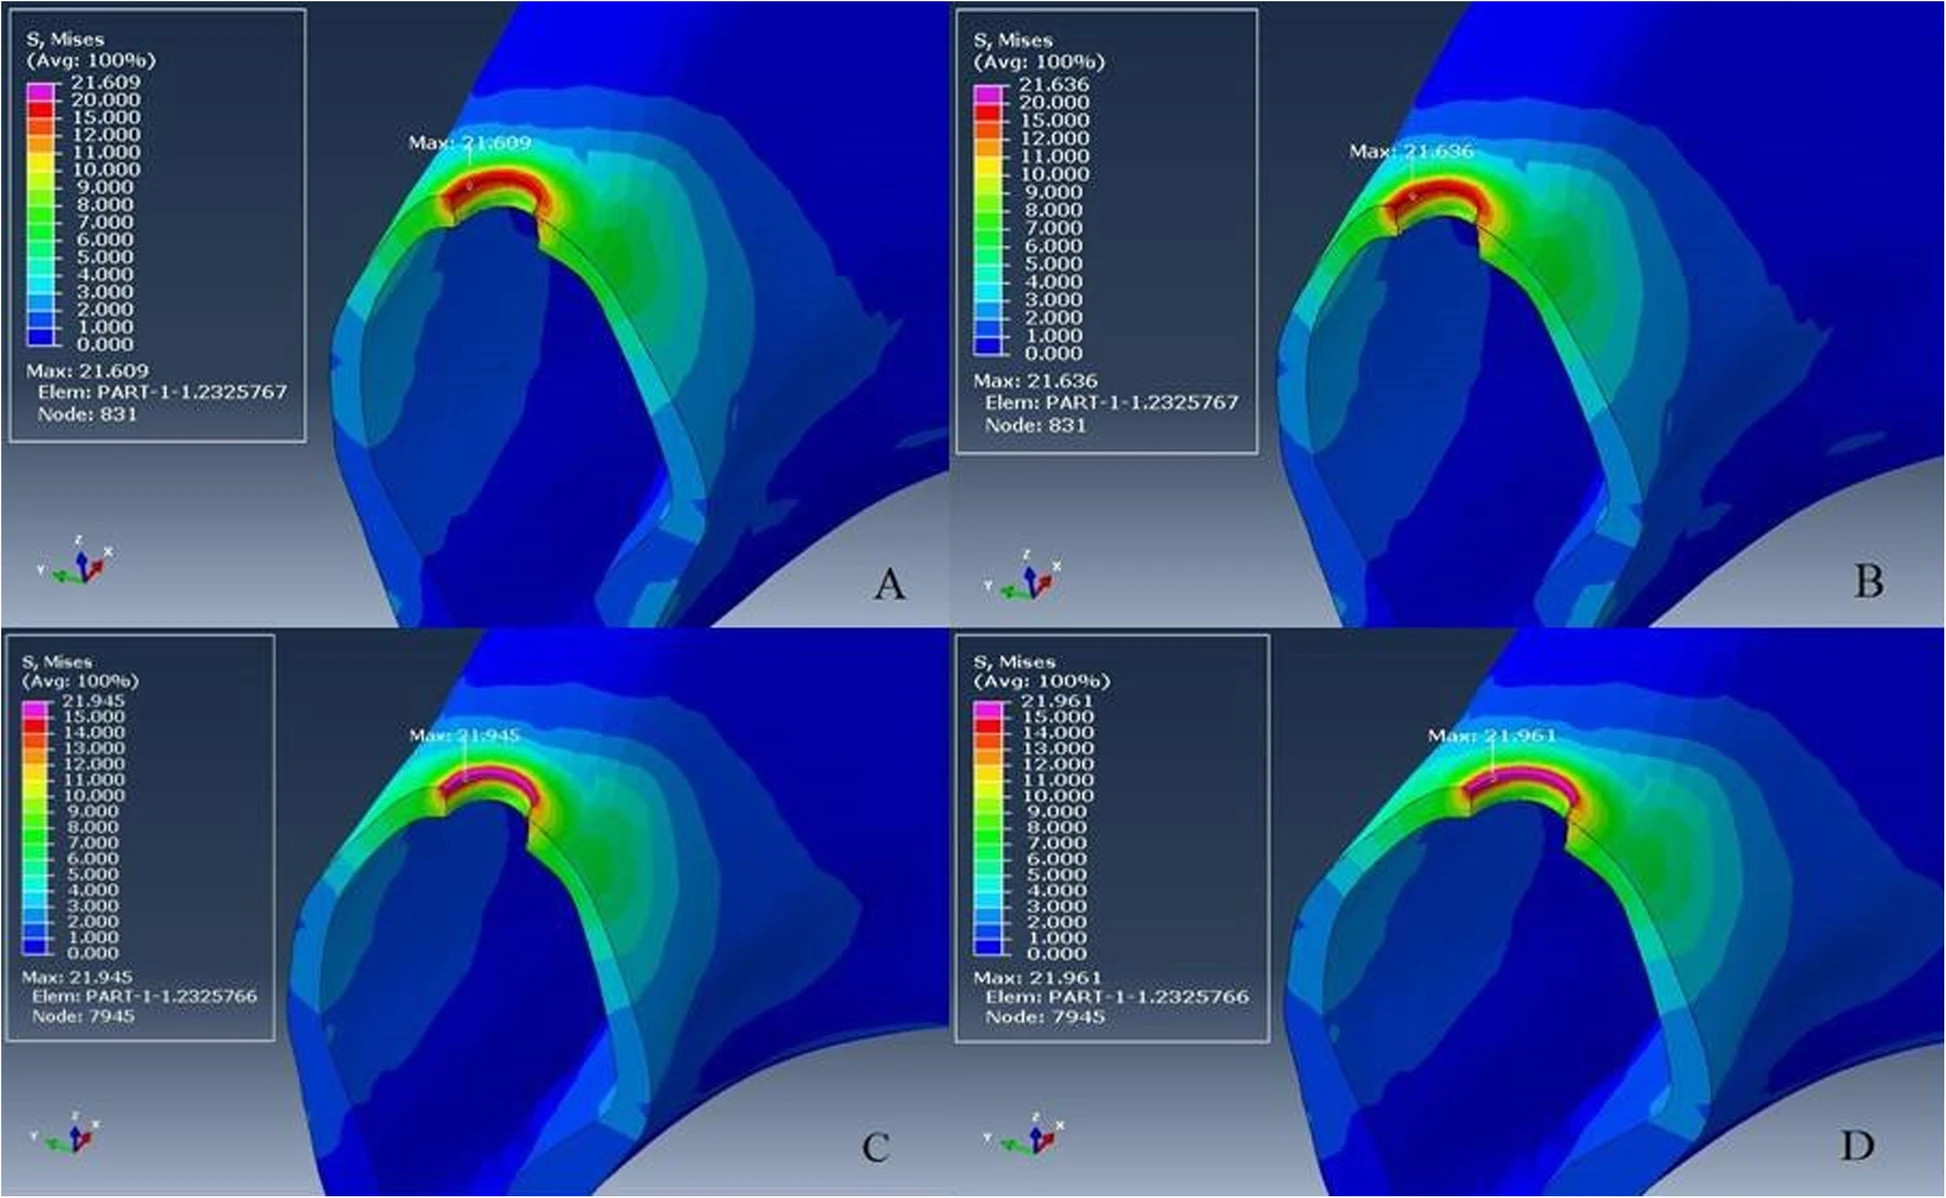
Figure 6. Figure 6. a–d Von Mises stress distribution on bone. From a to d: L-M, ZL-M, L-V, and ZL-V respectively. The stress concentration occurred in the cortical bone around the neck of the implant. Groups L-M and ZL-M were quite similar and reduced stress
Figure 6. Von Mises stress distribution on bone
author: Elif Yein Mustafa Hayati Atala | publisher: drg. Andreas Tjandra, Sp. Perio, FISID

Serial posts:
- Comparison of CAD/CAM manufactured implant-supported crowns with different analyses
- Background : Comparison of CAD/CAM manufactured implant-supported crowns
- Method : Comparison of CAD/CAM manufactured implant-supported crowns (1)
- Method : Comparison of CAD/CAM manufactured implant-supported crowns (2)
- Method : Comparison of CAD/CAM manufactured implant-supported crowns (3)
- Results : Comparison of CAD/CAM manufactured implant-supported crowns
- Discussion : Comparison of CAD/CAM manufactured implant-supported crowns (1)
- Discussion : Comparison of CAD/CAM manufactured implant-supported crowns (2)
- Discussion : Comparison of CAD/CAM manufactured implant-supported crowns (3)
- Discussion : Comparison of CAD/CAM manufactured implant-supported crowns (4)
- Discussion : Comparison of CAD/CAM manufactured implant-supported crowns (5)
- Conclusion : Comparison of CAD/CAM manufactured implant-supported crowns
- Table 1 The materials used in the study
- Table 2 The materials in the groups
- Figure 1. Crown restoration design
- Table 3 The properties of the materials used in FEA and the references of these values
- Table 4 Descriptive statistical analysis of the groups
- Figure 2. The graph of the interaction of the materials and restoration desig
- Figure 3. a–d Maximum principal stress distribution on crown restoration.
- Figure 4. a–d Von Mises stress distribution on implant.
- Figure 5. a–d Von Mises stress distribution on abutment.
- Figure 6. Von Mises stress distribution on bone