Platelet, Count, Spectrophotometry, Leukocytes, Red blood cells, Quality assurance
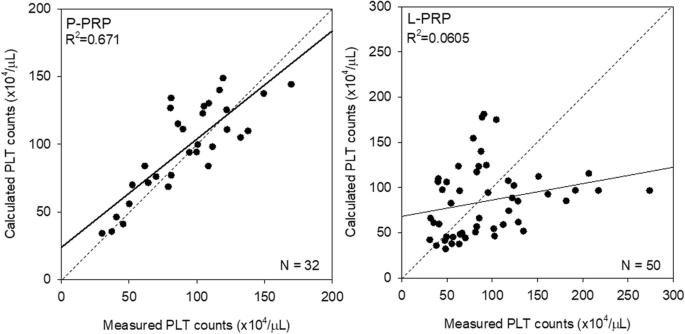
Fig. 7. Scatter plots representing correlations between measured and calculated platelet counts in P-PRP and L-PRP preparations. Note: a strong correlation was observed only in P-PRP. N = 32 and 50 for P-PRP and L-PRP, respectively : Spectrophotometric determination of platelet count
author: Yutaka Kitamura, Masashi Suzuki, Tsuneyuki Tsukioka, Kazushige Isobe, Tetsuhiro Tsujino, Taisuke Watanabe, Takao Watanabe, Hajim | publisher: drg. Andreas Tjandra, Sp. Perio, FISID

Fig. 7. Scatter plots representing correlations between measured and calculated platelet counts in P-PRP and L-PRP preparations. Note: a strong correlation was observed only in P-PRP. N = 32 and 50 for P-PRP and L-PRP, respectively
Serial posts:
- Abstract : Spectrophotometric determination of platelet counts in platelet-rich plasma
- Background : Spectrophotometric determination of platelet counts in platelet-rich plasma [1]
- Background : Spectrophotometric determination of platelet counts in platelet-rich plasma [2]
- Methods : Spectrophotometric determination of platelet counts in platelet-rich plasma [1]
- Methods : Spectrophotometric determination of platelet counts in platelet-rich plasma [2]
- Results : Spectrophotometric determination of platelet counts in platelet-rich plasma [1]
- Results : Spectrophotometric determination of platelet counts in platelet-rich plasma [2]
- Discussion : Spectrophotometric determination of platelet counts in platelet-rich plasma [1]
- Discussion : Spectrophotometric determination of platelet counts in platelet-rich plasma [2]
- Discussion : Spectrophotometric determination of platelet counts in platelet-rich plasma [3]
- Conclusions : Spectrophotometric determination of platelet counts in platelet-rich plasma
- Abbreviations : Spectrophotometric determination of platelet counts in platelet-rich plasma
- References : Spectrophotometric determination of platelet counts in platelet-rich plasma [1]
- References : Spectrophotometric determination of platelet counts in platelet-rich plasma [2]
- References : Spectrophotometric determination of platelet counts in platelet-rich plasma [3]
- References : Spectrophotometric determination of platelet counts in platelet-rich plasma [4]
- Availability of data and materials : Spectrophotometric determination of platelet counts in platelet-rich plasma
- Author information : Spectrophotometric determination of platelet counts in platelet-rich plasma [1]
- Author information : Spectrophotometric determination of platelet counts in platelet-rich plasma [2]
- Ethics declarations : Spectrophotometric determination of platelet counts in platelet-rich plasma
- Rights and permissions : Spectrophotometric determination of platelet counts in platelet-rich plasma
- About this article : Spectrophotometric determination of platelet counts in platelet-rich plasma
- Fig. 1. A compact SPM with its remote controller installed on an iPad Air. iPhones and other Android devices can be used instead of the iPad Air : Spectrophotometric determination of platelet count
- Fig. 2. The appearance of blood sampled after gravity fractionation and the resulting P-PRP and L-PRP. In the first low-speed spin, samples were centrifuged for 10 min at 533×g. For P-PRP preparation, the upper plasma fraction, which was 2 mm beyond the interface between plasma and RBC fractions, was transferred into sample tubes for the second high-speed spin (2656×g, 5 min). In contrast, for L-PRP preparation, the upper plasma fraction including the buffy coat and the surface of the RBC fraction was used for the second spin. The supernatant (PPP) was excluded by 50–70%, and platelets were resuspended in the remaining PPP fraction : Spectrophotometric determination of platelet count
- Fig. 3. Counts of platelets (PLT), WBCs, and RBCs in P-PRP and L-PRP preparations prepared for calibration curves. N = 14 for each type of PRP : Spectrophotometric determination of platelet count
- Fig. 4. Calibration curves of measured platelet counts versus absorbance in P-PRP and L-PRP preparations. The samples were serially diluted by PPP, and the platelet counts were determined using an AHA and SPM. N = 14 for each type of PRP : Spectrophotometric determination of platelet count
- Fig. 5. Counts of platelets (PLT), WBCs, and RBCs in P-PRP and L-PRP preparations prepared for validation testing. N = 32 and 50 for P-PRP and L-PRP, respectively : Spectrophotometric determination of platelet count
- Fig. 6. Scatter plots representing possible correlations between platelet (PLT) and WBC counts and between platelet and RBC counts in P-PRP and L-PRP preparations. Note: strong positive correlations were observed between platelets and RBC in both PRP types. N = 32 and 50 for P-PRP and L-PRP, respectively : Spectrophotometric determination of platelet count
- Fig. 7. Scatter plots representing correlations between measured and calculated platelet counts in P-PRP and L-PRP preparations. Note: a strong correlation was observed only in P-PRP. N = 32 and 50 for P-PRP and L-PRP, respectively : Spectrophotometric determination of platelet count