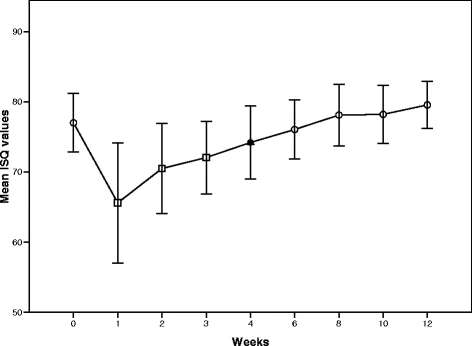
Figure 2. Change in the mean ISQ values over time. There was a statistically significant decrease in the mean ISQ values between 1 and 3 weeks (P < 0.05). The ISQ values recovered to the initial ISQ values at 4 weeks and slight increased at 6, 8, 10, and 12 weeks
Figure 2. Change in the mean ISQ values over time
author: Choknapa Tirachaimongkol,Peraphan Pothacharoen,Peter A Reichart, Pathawee Khongkhunthian | publisher: drg. Andreas Tjandra, Sp. Perio, FISID

Serial posts:
- Relation between the stability of dental implants and two biological markers
- Background : Relation between the stability of dental implants (1)
- Background : Relation between the stability of dental implants (2)
- Methods : Relation between the stability of dental implants (1)
- Methods : Relation between the stability of dental implants (2)
- Methods : Relation between the stability of dental implants (3)
- Methods : Relation between the stability of dental implants (4)
- Results : Relation between the stability of dental implants
- Discussion : Relation between the stability of dental implants (1)
- Discussion : Relation between the stability of dental implants (2)
- Discussion : Relation between the stability of dental implants (3)
- Reference : Relation between the stability of dental implants
- Table 1 Inclusion and exclusion criteria
- Table 2 Profile of patients
- Table 3 ISQ values according to gender and bone quality
- Table 4 Crevicular fluid volume
- Table 5 Crevicular fluid ALP and OC levels
- Figure 1. Timeline of the clinical study
- Figure 2. Change in the mean ISQ values over time
- Figure 3. Change in the median values
- Figure 4. Change in the median values of the ALP level over time
- Figure 5. Change in the median values of the OC level over time
- Figure 6. There were weakly significant and positive correlations
- Figure 7. Comparison between biomarker levels & ISQ values
- Figure 8. There were moderately significant and positive correlations