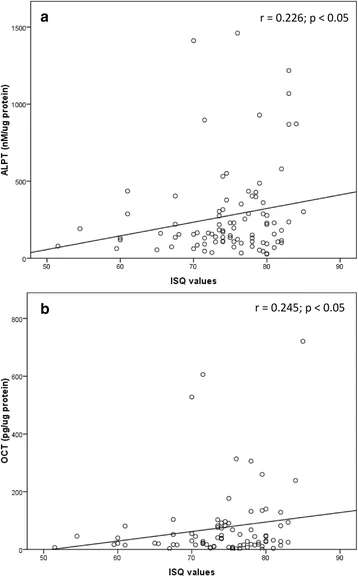
Figure 6. There were weakly significant and positive correlations between the ALP or OC levels and ISQ values at all measurements from week 1 to week 12. At the implant site, the ALP levels in nM/μg protein (a) or the OC levels in pg/μg protein (b) were associated with ISQ values
Figure 6. There were weakly significant and positive correlations
author: Choknapa Tirachaimongkol,Peraphan Pothacharoen,Peter A Reichart, Pathawee Khongkhunthian | publisher: drg. Andreas Tjandra, Sp. Perio, FISID

Serial posts:
- Relation between the stability of dental implants and two biological markers
- Background : Relation between the stability of dental implants (1)
- Background : Relation between the stability of dental implants (2)
- Methods : Relation between the stability of dental implants (1)
- Methods : Relation between the stability of dental implants (2)
- Methods : Relation between the stability of dental implants (3)
- Methods : Relation between the stability of dental implants (4)
- Results : Relation between the stability of dental implants
- Discussion : Relation between the stability of dental implants (1)
- Discussion : Relation between the stability of dental implants (2)
- Discussion : Relation between the stability of dental implants (3)
- Reference : Relation between the stability of dental implants
- Table 1 Inclusion and exclusion criteria
- Table 2 Profile of patients
- Table 3 ISQ values according to gender and bone quality
- Table 4 Crevicular fluid volume
- Table 5 Crevicular fluid ALP and OC levels
- Figure 1. Timeline of the clinical study
- Figure 2. Change in the mean ISQ values over time
- Figure 3. Change in the median values
- Figure 4. Change in the median values of the ALP level over time
- Figure 5. Change in the median values of the OC level over time
- Figure 6. There were weakly significant and positive correlations
- Figure 7. Comparison between biomarker levels & ISQ values
- Figure 8. There were moderately significant and positive correlations