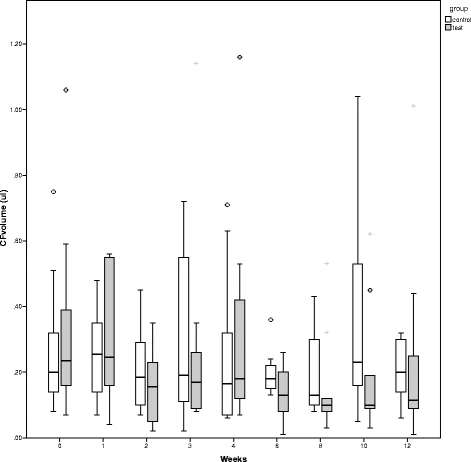
Figure 3. Change in the median values of the GCF (control group) and PICF (test group) volume over time. In the test group, the PICF volume continuously decreased with time (a). There were no significant differences in the median values of the crevicular fluid volume in either the control group or the test groups at any measurement (b)
Figure 3. Change in the median values
author: Choknapa Tirachaimongkol,Peraphan Pothacharoen,Peter A Reichart, Pathawee Khongkhunthian | publisher: drg. Andreas Tjandra, Sp. Perio, FISID

Serial posts:
- Relation between the stability of dental implants and two biological markers
- Background : Relation between the stability of dental implants (1)
- Background : Relation between the stability of dental implants (2)
- Methods : Relation between the stability of dental implants (1)
- Methods : Relation between the stability of dental implants (2)
- Methods : Relation between the stability of dental implants (3)
- Methods : Relation between the stability of dental implants (4)
- Results : Relation between the stability of dental implants
- Discussion : Relation between the stability of dental implants (1)
- Discussion : Relation between the stability of dental implants (2)
- Discussion : Relation between the stability of dental implants (3)
- Reference : Relation between the stability of dental implants
- Table 1 Inclusion and exclusion criteria
- Table 2 Profile of patients
- Table 3 ISQ values according to gender and bone quality
- Table 4 Crevicular fluid volume
- Table 5 Crevicular fluid ALP and OC levels
- Figure 1. Timeline of the clinical study
- Figure 2. Change in the mean ISQ values over time
- Figure 3. Change in the median values
- Figure 4. Change in the median values of the ALP level over time
- Figure 5. Change in the median values of the OC level over time
- Figure 6. There were weakly significant and positive correlations
- Figure 7. Comparison between biomarker levels & ISQ values
- Figure 8. There were moderately significant and positive correlations